The 2025/2026 Premier League season has already begun to reveal significant differences between teams in how effectively they convert shooting opportunities into goals.
While league standings often reflect overall performance, examining shot quality, expected goals (xG), and finishing efficiency provides a deeper understanding of whether a team is genuinely performing at its level or overachieving in ways unlikely to be sustained.
Some sides have climbed the table on the back of exceptional conversion rates despite generating modest xG, raising questions about how long such finishing form can realistically continue.
Others have created a high volume of quality chances but struggled to convert, suggesting potential upward movement as finishing regresses to the mean.
These underlying numbers offer crucial tactical insights, highlighting which teams depend heavily on moments of individual efficiency and which rely on structurally consistent chance creation.
Understanding these patterns can clarify whether the current league table reflects sustainable performance or temporary overperformance.
In this Premier League data analysis, we will examine shot volume, shot quality, xG trends, and finishing efficiency to assess sustainability and tactical implications.
Tactical Interpretation Of Shot Quality Across The First 12 Gameweeks
Across the opening 12 matchweeks of the 2025/2026 EPL season, shot-quality trends reveal several notable tactical patterns that help explain both sustainable performers and sides whose league position may be inflated by short-term finishing spikes.
Comparing Premier League Teams’ Shot Volume & Expected Goals In First 12 Matches 2025/2026

Arsenal, who sit top with 29 points, combine high shot volume (160) with strong xG generation (18.8) and an above-expected return of 24 goals, suggesting a team whose tactical structure reliably produces chances but is also benefiting from efficient finishing.
Chelsea and Manchester City share similar profiles; both generate high xG figures (20.4 and 19.3, respectively) backed by substantial shot volume, suggesting their positions near the top of the table reflect sustainable attacking processes.
Tottenham Hotspur and Burnley stand out as potential overachievers, with Spurs scoring 20 goals from only 11 xG and Burnley converting 14 goals from 8.2 xG, finishing levels that typically regress over time.
At the other end, Wolves’ return of just seven goals from 9.6 xG highlights a finishing deficit that has contributed to their low tally of 2 points despite creating chances comparable to those of mid-table sides.
As part of Chelsea’s broader attacking profile, João Pedro’s early-season numbers offer a revealing micro-level perspective.
João Pedro Shot Map With Chelsea 2025/2026 – First 12 GW
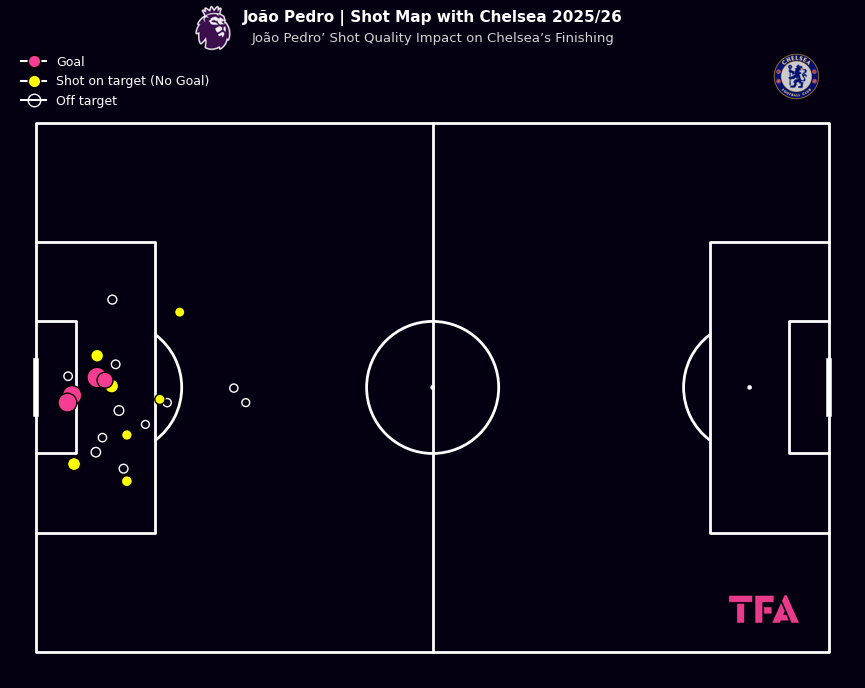
Over the first 12 gameweeks, João Pedro’s shot map aligns with Chelsea’s strong underlying attacking metrics.
He has taken 21 shots, with 13 of them hitting the target, producing an xG total of 4.04 and scoring four goals.
This return equates to 0.19 goals per shot, a figure that aligns almost perfectly with his xG output, suggesting that his finishing neither overperforms nor underperforms expectation.
The distribution of his shots, mainly from central areas inside the box, reinforces the tactical structure highlighted in the wider analysis, in which Chelsea’s chance creation stems from sustained pressure and high-possession sequences.
His ability to convert at an xG-aligned rate indicates that the team’s attacking performance is built on repeatable patterns rather than streaks of clinical finishing.
These numbers also emphasise that Chelsea’s position near the top of the table is supported by structurally consistent shot quality rather than short-term variance.
Within the broader context of mid-table teams, Brentford’s attacking output and Igor Thiago’s numbers merit closer tactical attention.
Igor Thiago Shot Map With Brentford 2025/2026 – First 12 GWs
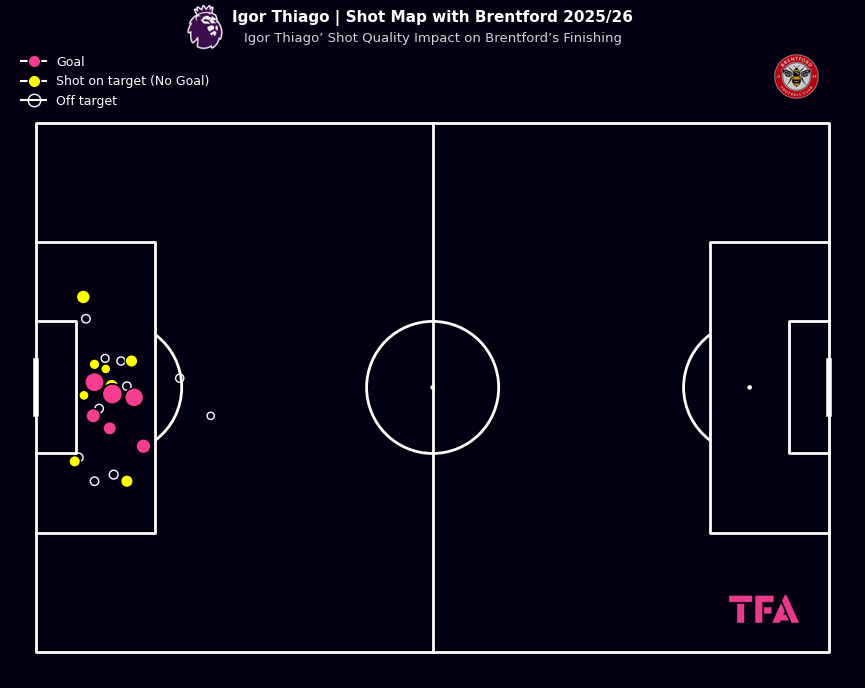
Igor Thiago has been Brentford’s most decisive attacking figure across the opening 12 gameweeks, producing a shot profile that stands out in a team currently positioned 13th with 16 points.
He has attempted 28 shots, hitting the target 16 times, and scoring nine goals from an xG of 7.37.
This equates to 0.32 goals per shot and 0.26 goals per xG, indicating a slight but notable overperformance in finishing efficiency.
His ability to consistently strike from advantageous central areas underlines Brentford’s reliance on direct attacking sequences and transitional moments to generate high-value chances.
While the numbers suggest strong individual efficiency, they also raise questions about sustainability, especially for a side whose overall attacking metrics reflect mid-table stability rather than top-end sharpness.
Non-Penalty Shot Quality Across the First 12 Premier League Gameweeks
Across the opening 12 gameweeks, non-penalty shot quality provides a clearer tactical indicator of how reliably each Premier League side creates chances independent of set-piece variance.
Premier League 2025/2026 Difference Between Non-Penalty Goals & Non-Penalty xG – First 12 Matches

Chelsea and Manchester City emerge as the league’s most structurally consistent attackers, generating the highest non-penalty xG values (19.6 and 18.5), supported by strong shot volumes and respectable non-penalty xG per shot figures (0.13 and 0.12).
In contrast, Tottenham and Burnley stand out as clear overperformers.
Spurs have scored 20 goals from just 11 non-penalty xG, while Burnley’s return of 14 goals from 8.2 non-penalty xG signals finishing levels far above expected efficiency.
At the opposite end, Crystal Palace and Wolves both underperform significantly, with Palace recording a striking –6.5 non-penalty goals minus xG.
These deficits highlight structural issues in chance quality and suggest that their attacking output lacks repeatability.
Bournemouth & Antoine Semenyo: Linking Structured Chance Creation To Sustainable Finishing
Within the wider themes of shot quality, finishing efficiency, and xG trends discussed throughout this report, Bournemouth and Antoine Semenyo offer a clear example of how structured chance creation translates into sustainable output.
Antoine Semenyo has been central to AFC Bournemouth’s attacking output in the 2025/2026 Premier League, perfectly reflecting Andoni Iraola’s proactive offensive approach.
Antoine Semenyo Shot Map With AFC Bournemouth 2025/2026
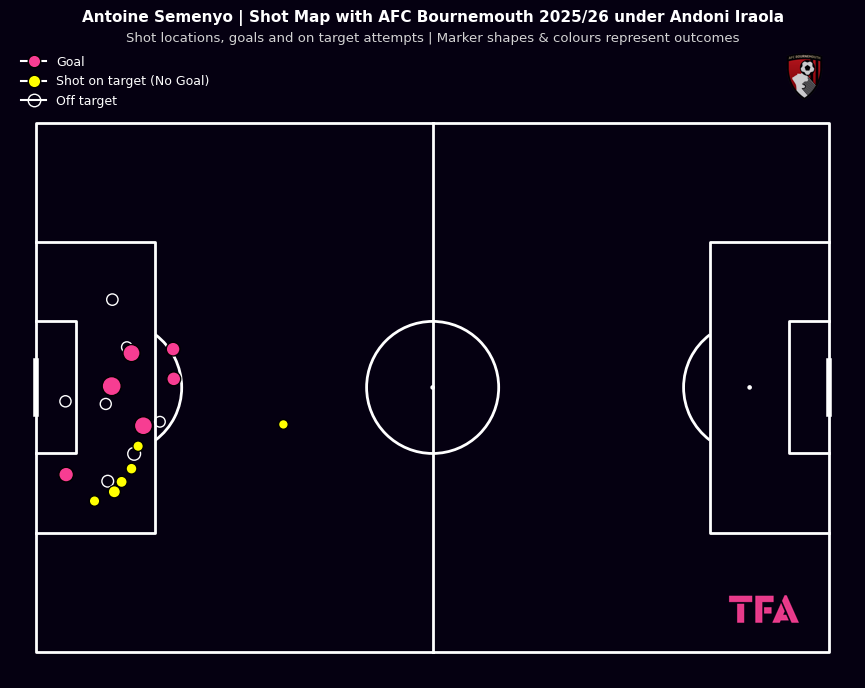
The Ghanaian forward has scored six goals from 23 shots, generating an xG of 4.6, equating to 0.26 goals per shot, while also providing three assists and creating 11 clear chances.
His shot map highlights a preference for central positions inside the box, demonstrating both high-quality opportunity selection and effective finishing.
Semenyo’s pressing and off-the-ball contributions, including nine recoveries in the final third, underline Bournemouth’s structured attacking philosophy.
Currently eighth with 19 points, Bournemouth benefit from his consistent xG-aligned output, linking individual finishing efficiency to team-level tactical performance.
Manchester City’s Scoring Challenges Without Erling Haaland
Manchester City’s attacking output without Erling Haaland across the first 12 Premier League gameweeks has been strikingly limited.
Manchester City Players Shooting Volume & Expected Goals In First 12 Matches 2025/2026

Beyond Haaland’s 14 goals from 51 shots, no other player has scored more than a single goal, with Tijjani Reijnders contributing one goal from an xG of 1.53, highlighting minimal finishing efficiency.
Phil Foden and Jérémy Doku have also managed only one goal each, despite reasonable shot volumes, while several others, including Rúben Dias and Bernardo Silva, have failed to score entirely.
Shot conversion rates are notably low across the squad, and xG per shot figures remain underwhelming, underlining City’s heavy reliance on Haaland for both quantity and quality of goal-scoring opportunities.
Erling Haaland Shot Map With Manchester City 2025/2026 – First 12 GWs
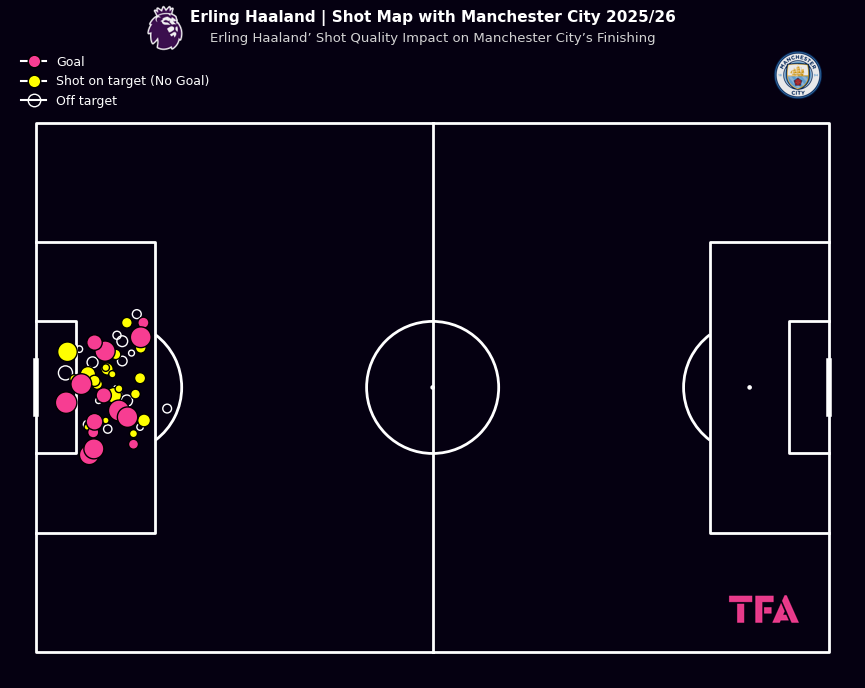
Erling Haaland has dominated City’s attacking output, taking 51 shots with 31 on target, scoring 14 goals from a cumulative xG of 12.64.
His xG per shot of 0.25 and goals per shot of 0.28 indicate exceptional finishing efficiency.
The shot map reveals his tendency to operate centrally in the box, converting high-quality chances consistently, demonstrating both tactical positioning and clinical execution that the team relies on heavily.
Shot-Creating Actions & Their Influence On Shot Quality – Premier League 2025/2026, First 12 Gameweeks
Across the opening 12 Premier League gameweeks, Shot-Creating Actions (SCAs) offer an insightful lens for assessing both the volume and quality of teams’ offensive output.
Premier League 2025/2026 Shot-Creating Actions – First 12 Matches
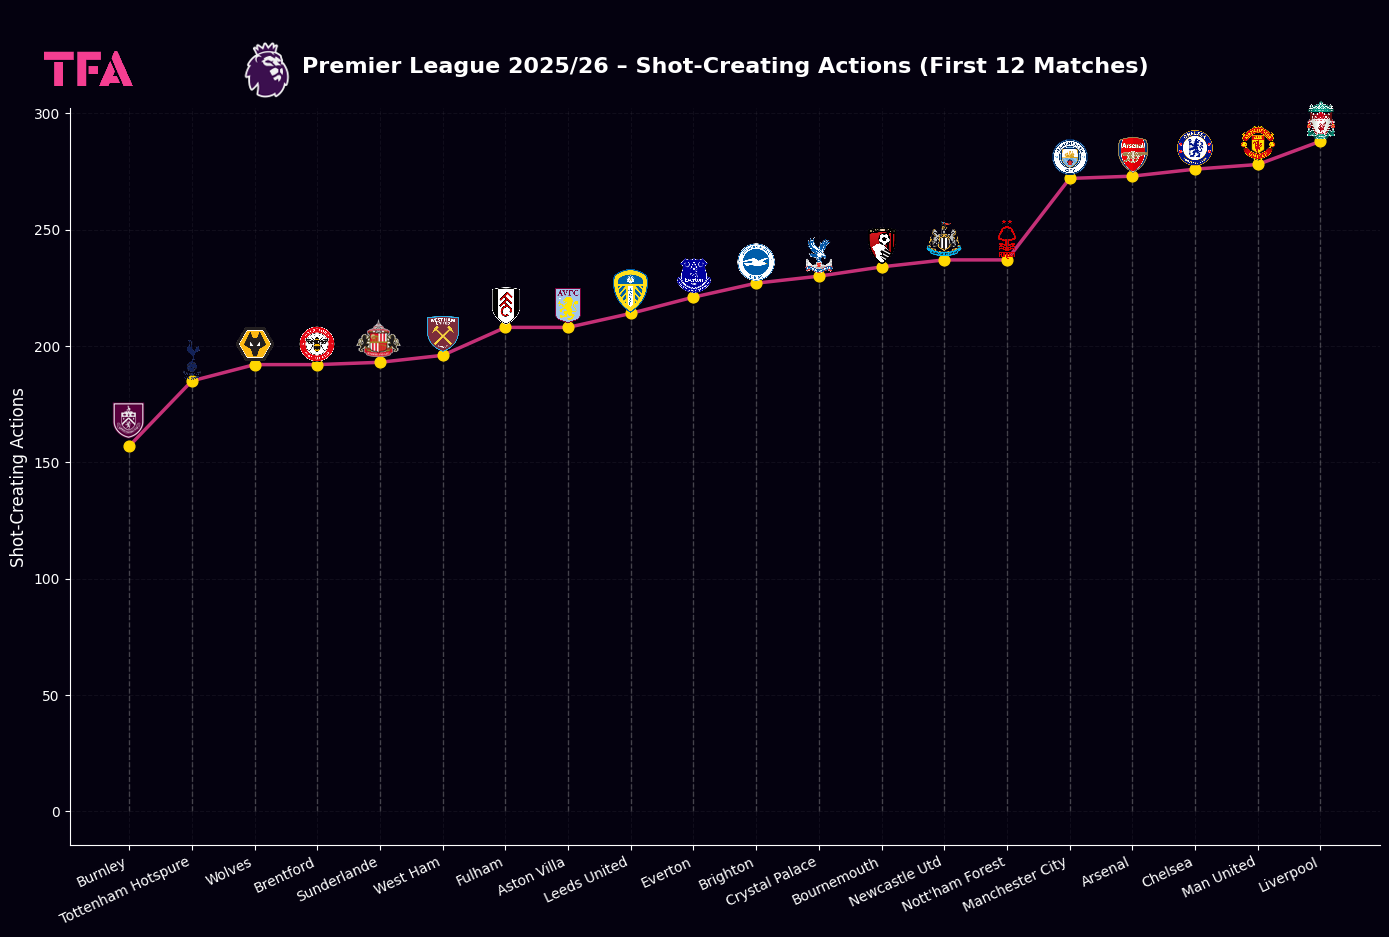
Teams like Liverpool, Chelsea, and Manchester United lead in SCAs per 90, with figures of 26.18, 25.09, and 25.27, respectively, highlighting their capacity to generate opportunities through live-ball passes, dead-ball deliveries, take-ons, and shots.
Arsenal’s balanced contribution of 24.82 SCAs per 90, predominantly from live-ball passes (195) and shots (28), underscores the correlation between structured creativity and above-expected goal returns.
Conversely, lower SCA figures, as seen with Burnley (14.27 per 90) and Wolves (17.45), coincide with reduced shot quality and underperformance relative to xG.
Overall, high SCA rates correlate strongly with sustained shot quality, emphasising that teams producing consistent chance-creating actions are better positioned to maintain efficient finishing and offensive stability.
Liverpool’s start to the 2025/26 Premier League season has been unexpectedly poor, with the team languishing in 12th place on just 18 points after 12 matches.
Mohamed Salah, despite his proven quality, has managed only 4 goals from 30 shots, resulting in an xG of 3.63.
Mohamed Salah Shot Map With Liverpool 2025/2026 – First 12 GWs
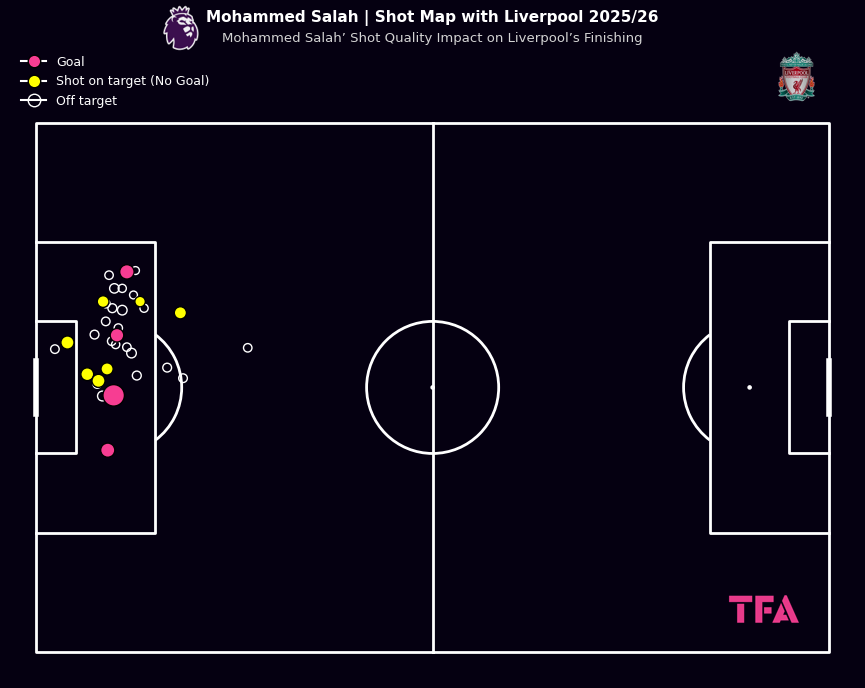
This reflects limited shot quality and few high-value chances created for him; the data underlines both a decline in Salah’s finishing efficiency and tactical shortcomings from manager Arne Slot, who has struggled to provide him with consistently advantageous positions.
Consequently, Salah’s output illustrates that individual efficiency alone cannot compensate for structural inefficiencies in creating opportunities, linking the team’s poor results directly to a lack of quality opportunities.
In contrast, Arsenal sit top of the table with 29 points, demonstrating a far more effective attacking structure.
Viktor Gyökeres Shot Map With Arsenal 2025/2026 – First 12 GWs
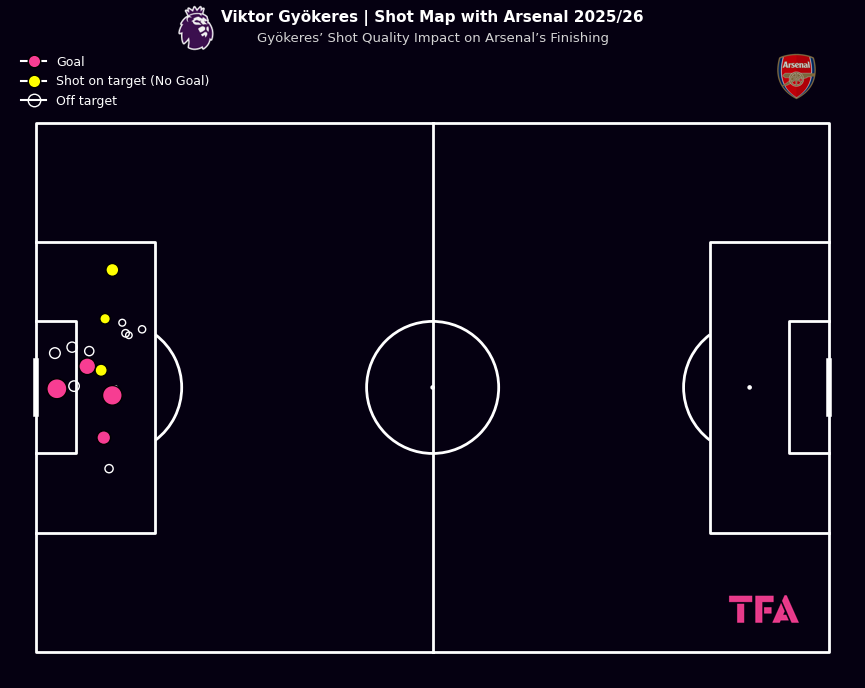
Viktor Gyökeres, despite an initially uncertain start, has scored four goals from 20 shots with a total xG of 4.64.
This equates to 0.23 xG per shot and 0.20 xG per goal, highlighting his ability to consistently find himself in high-quality scoring positions.
The team’s tactical approach ensures he receives well-structured chances, linking individual finishing efficiency to Arsenal’s sustained offensive performance and first-place position, in stark contrast to Liverpool’s struggles.
Conclusion
The first 12 gameweeks of the 2025/2026 Premier League season underline the crucial link between structured chance creation and sustainable attacking performance.
Teams like Arsenal, Chelsea, and Manchester City demonstrate that high-quality shot generation, supported by consistent tactical frameworks, correlates with both above-expected goal returns and table stability.
Conversely, sides such as Liverpool and Wolves illustrate how individual finishing talent alone cannot offset limited opportunity creation, resulting in underperformance relative to xG.
Overall, analysing shot quality, xG trends, and SCAs provides a clear indicator of which teams are likely to maintain offensive efficiency and which may face regression as the season progresses.