Corners are probably the most analysed aspect of set-pieces in football, with their proximity to the goal highlighting them an obvious area that should be worked on. While teams do work on corners, as with anything in football, some teams just do it better, and despite teams improving in this aspect, many still waste several corners with a lack of intent, coordination, and intelligent movement.
One of the biggest variations from team to team is where they target their corners, with little answers provided anywhere on which zone is the most efficient and indeed then how you attack that zone. As a result, I’ve been prompted to write this series of analyses which has initially used data to find the best teams in each specific zone, before then analysing every corner taken this season by these teams to identify how they attack their zone so effectively. The whole series involved the analysis of over 2000 corners and provides the behaviour and structural trends the best teams display in each zone.
This tactical analysis, as the first in the series, will review general efficiency of teams across Europe, before then looking at who the best teams are in the near post zone, and what makes them the best.
Overall efficiency
To assess which teams performed the ‘best’, myself and Márton Balla (who helped me with the data aspect) took efficiency into account, and so calculated an average xG generated per 5 corners from a team. Teams with substantially more corners should naturally generate more xG, and so calculating purely from raw xG would likely remove teams who have fewer opportunities. Below we can see a graph which doesn’t take zones into account and just plots xG per five corners against corners per game.
In terms of efficiency, we see Union Berlin are the top team in Europe’s top five leagues, with the Germans able to generate around 0.21 xG per five corners. Toulouse lie just behind them in efficiency, while the teams with more corners such as RB Leipzig, Everton, West Ham are also performing well. Bayern Munich and Juventus seem to be performing well compared to teams who have a similar amount of corners, and surprisingly we see Liverpool’s xG per five corners is fairly low compared to other teams. This isn’t to say they are poor by any means, as they have generated nine goals from 3.89 xG, but the fact other teams have produced higher xG suggests that Liverpool can also improve and become more efficient.
The worst team from the top five leagues was Paderborn, who averaged only 0.031 xG per five corners, totalling up to 1.00 xG for the season. Lecce also sit next to them on the graph, but they rank lowly due to their high proportion of short corners, with Wyscout not accounting for xG from short corners. As a result, teams who use lots of short corners will rank lowly on this graph, but I’ll address the best teams in this area in a later section.

For a brief look across all the leagues, I calculated the xG per corner in each league, by calculating xG per game and the average number of corners. We can see the Bundesliga boasts the highest xG per corner, with Ligue 1 second. A number of variables could go into these figures, such as quality of defending, quality of attack and luck, but the Bundesliga being highest agrees with the general trend seen in the graph above of the Bundesliga containing lots of teams generating high xG from corners. For teams like Toulouse in Ligue 1, it seemed to me when analysing their corners that the defence contributed more to allowing high xG chances, rather than intelligent movement by the attackers.

The near post
To give an idea of the best teams in each zone, we plotted the number of attempts into one zone per 100 corners, against xG per 5 corners into that zone. We can see sides such as Wolfsburg and West Brom stand out in xG, but this is due to a low number of attempts into the zone, suggesting perhaps routined play rather than a real focus on the near post. Teams like Atalanta, who delivered 96 total corners into the near post zone, seem to place more of a general focus around the near post area. Valencia are one of the worst-performing teams in the near post in terms of efficiency, attempting 61 deliveries to this zone and registering only four shots and 0.36 xG in total for the whole season, leading to a measly 0.03 xG per 5 corners in this area.

As a result of this graph and the one above, the teams we focused on to judge how best to attack this zone were Arsenal, Juventus, Marseille (OM) and Atalanta. The aim of the article is to find general principles of attacking in each zone, rather than specific routines, and so teams who regularly use the zone successfully were used as case studies. This graph below shows teams who take an above-average number of near post corners and arranges them in order of xG per 5 near post corners. Marseille were chosen over Nantes due to a superior number of shots, while Atalanta were used due to their very high number of deliveries which is not represented in this graph.

Juventus
One of the main trends in Juventus’ use of the near post zone is their use of two takers standing over the corner. The advantage of this is that the defending team sets the height of their zonal players based on the type of delivery. Naturally, for an inswinger, because the ball is swinging towards goal, the defence sits deeper compared to an outswinger. With two players standing over the corner, it becomes difficult for the opposition to set the height of their defence, as they don’t know if an inswinger or outswinger will occur. As a result, space can be exploited depending on the opposition’s decision.
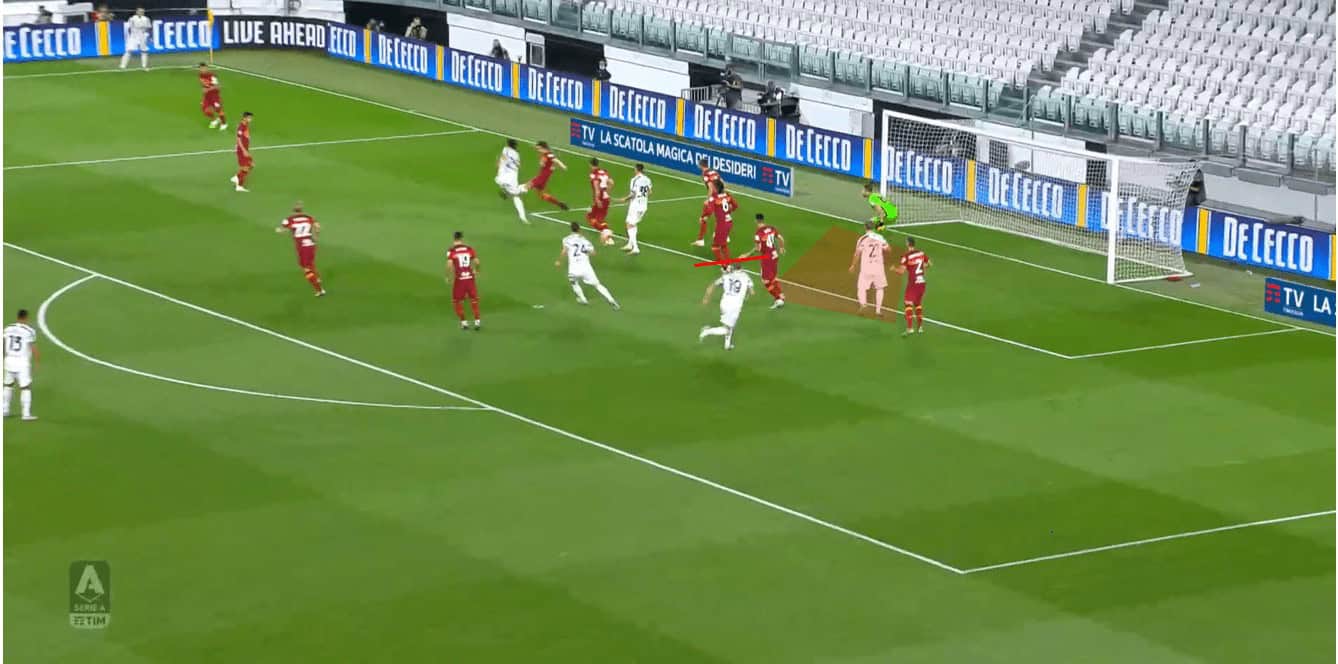
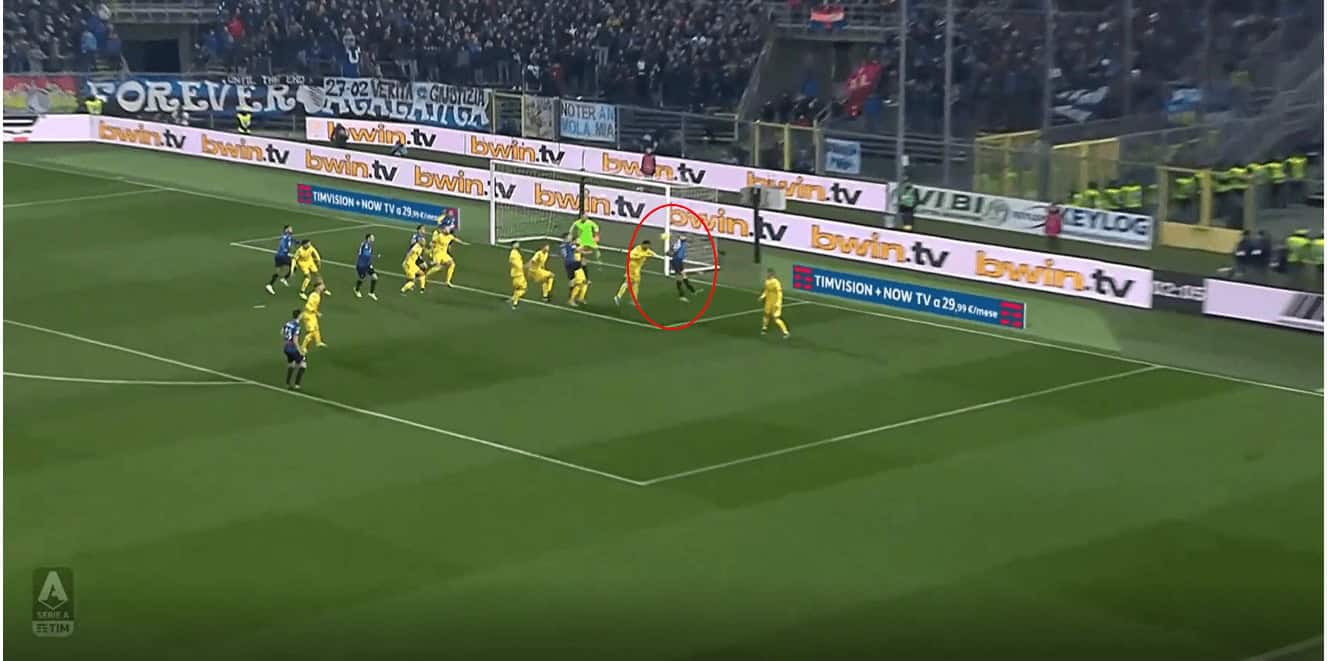
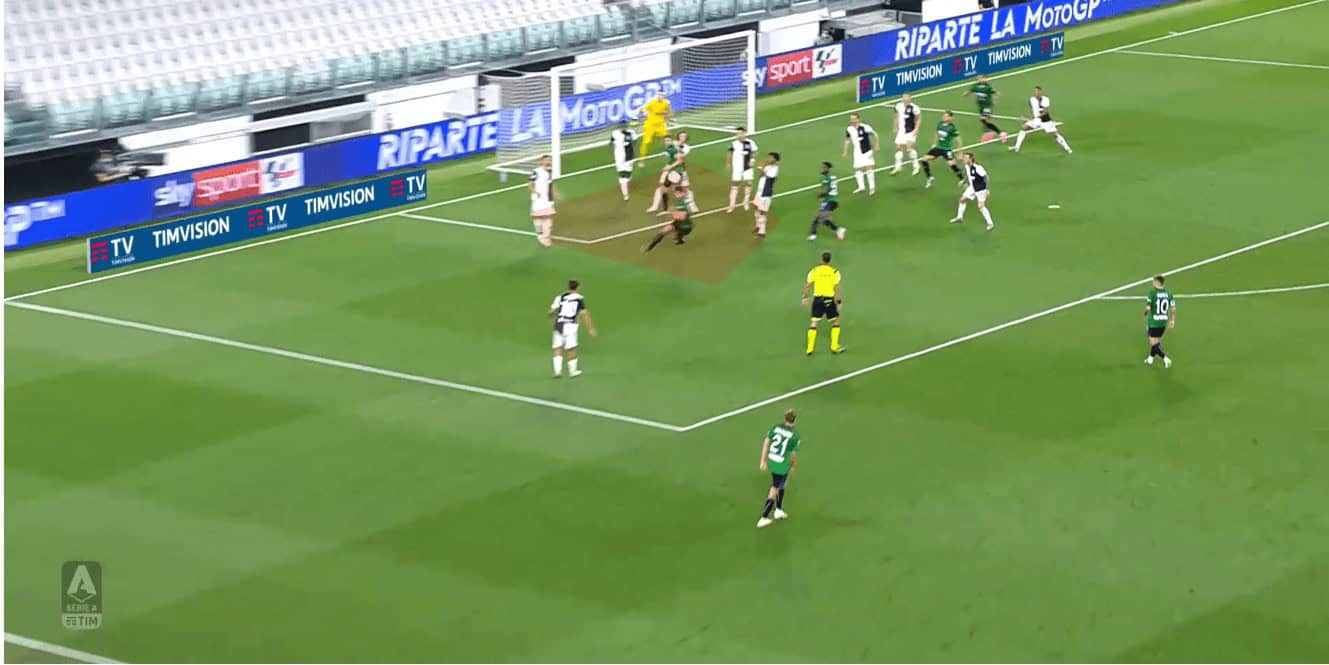
Below is a perfect example of this concept paired with excellent offensive movement. We see Juventus have two players over the corner, while target player Cristiano Ronaldo starts at the back post. He and teammate Higuaín perform what is known as a scissor movement, where players cross lanes in opposite directions to dismark an opponent. Due to the two corner takers and the potential for an inswinger, we see a Sassuolo zonal marker drops deep to protect against an inswinger, conceding the space in front of him.
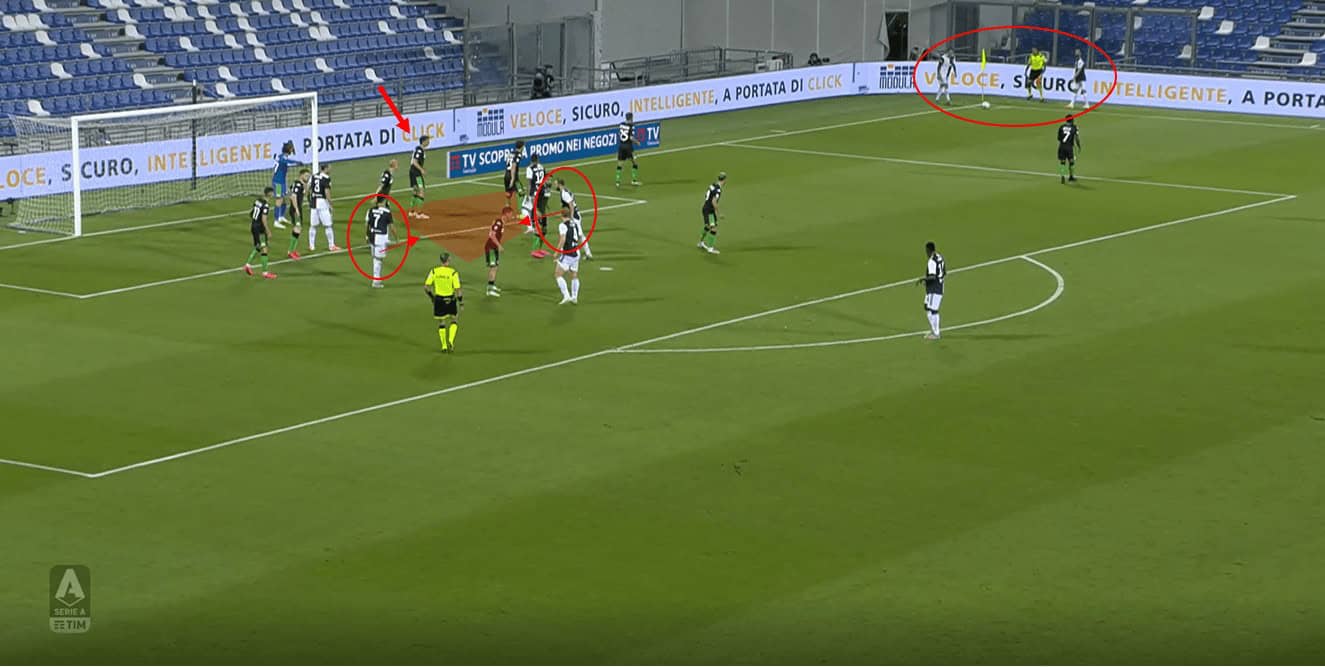
Gonzalo Higuaín is marked, and so he drags his runner towards the back post with a run, prompting Ronaldo to time a run in the opposite direction to Higuaín’s (scissor run). Ronaldo is, therefore, able to get a run in behind the Argentinian’s marker, and so he has a free run at that near post space. We see the Juventus player offering the option of an inswinger steps over the ball, meaning an outswinger will be delivered. Alex Sandro (number twelve) also makes a move towards the taker, which helps to open the space behind also.
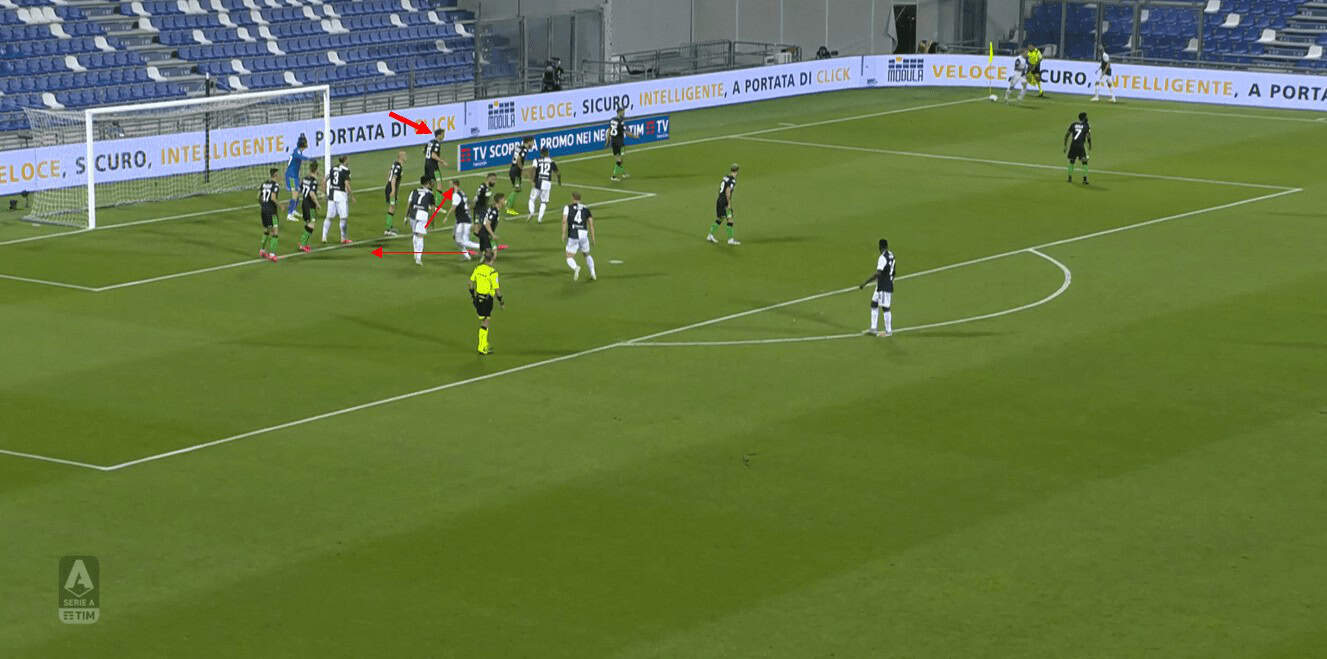
Therefore, Ronaldo has a free run at that near post space, and the two corner takers have forced a zonal player at that near post space deeper. This means Ronaldo is able to win the header and get the shot off, resulting in a 0.26xG chance.
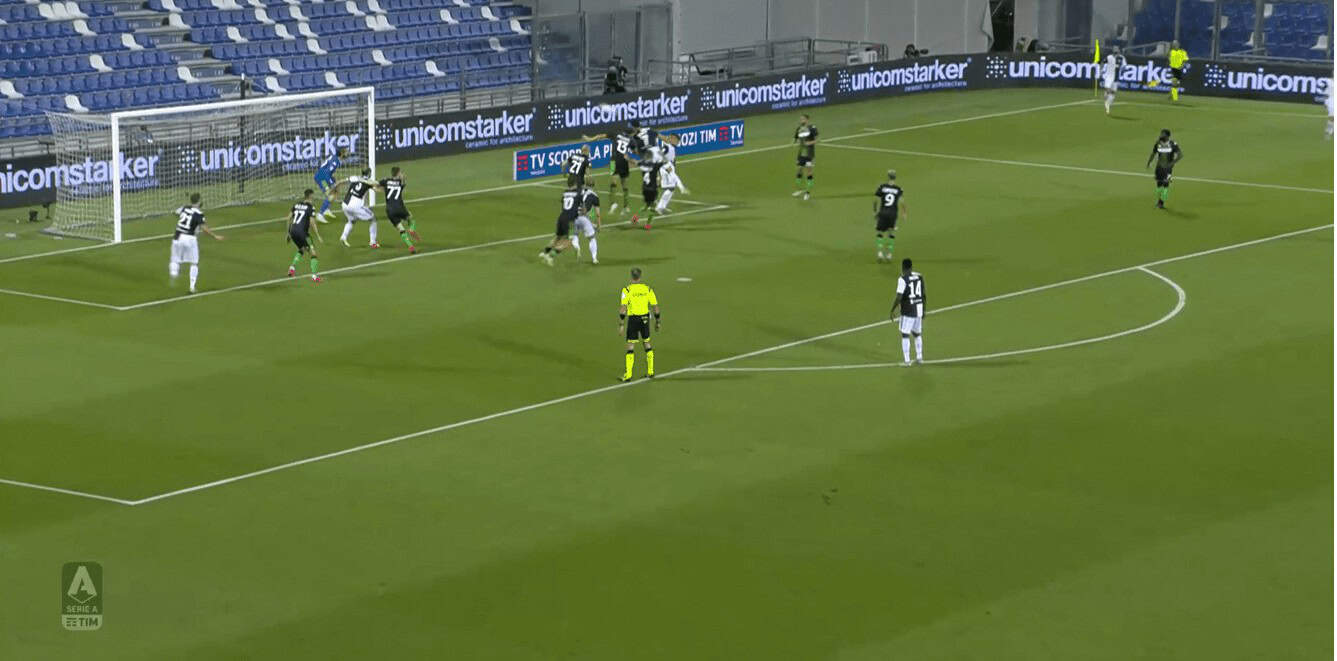
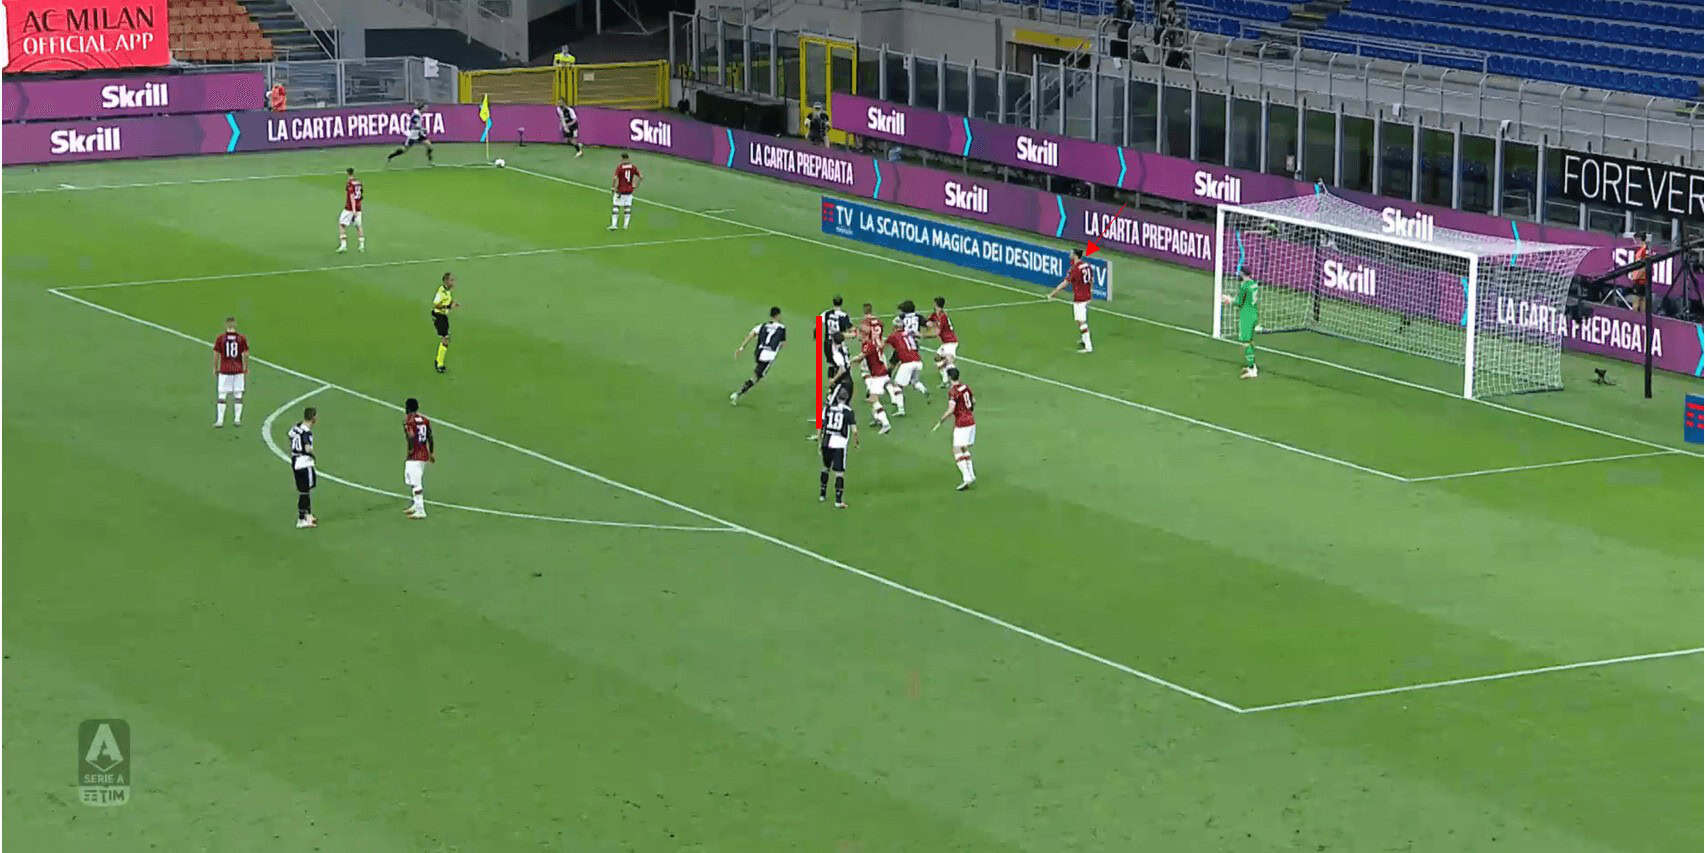
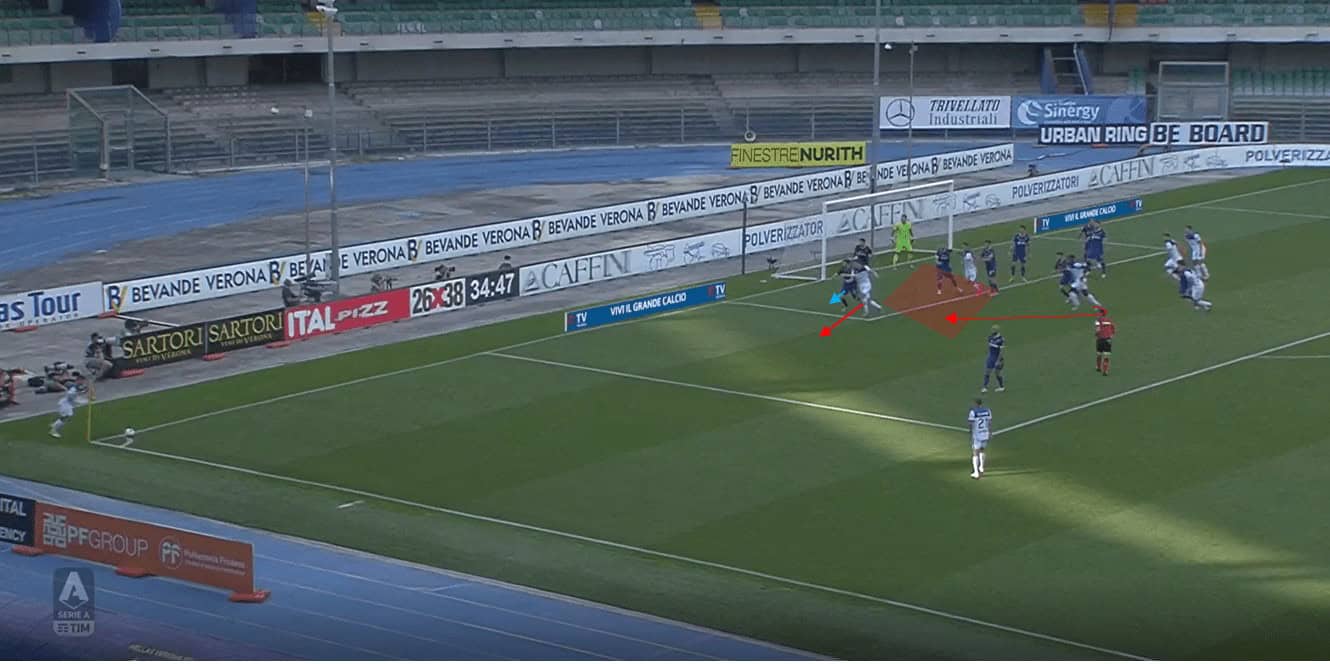
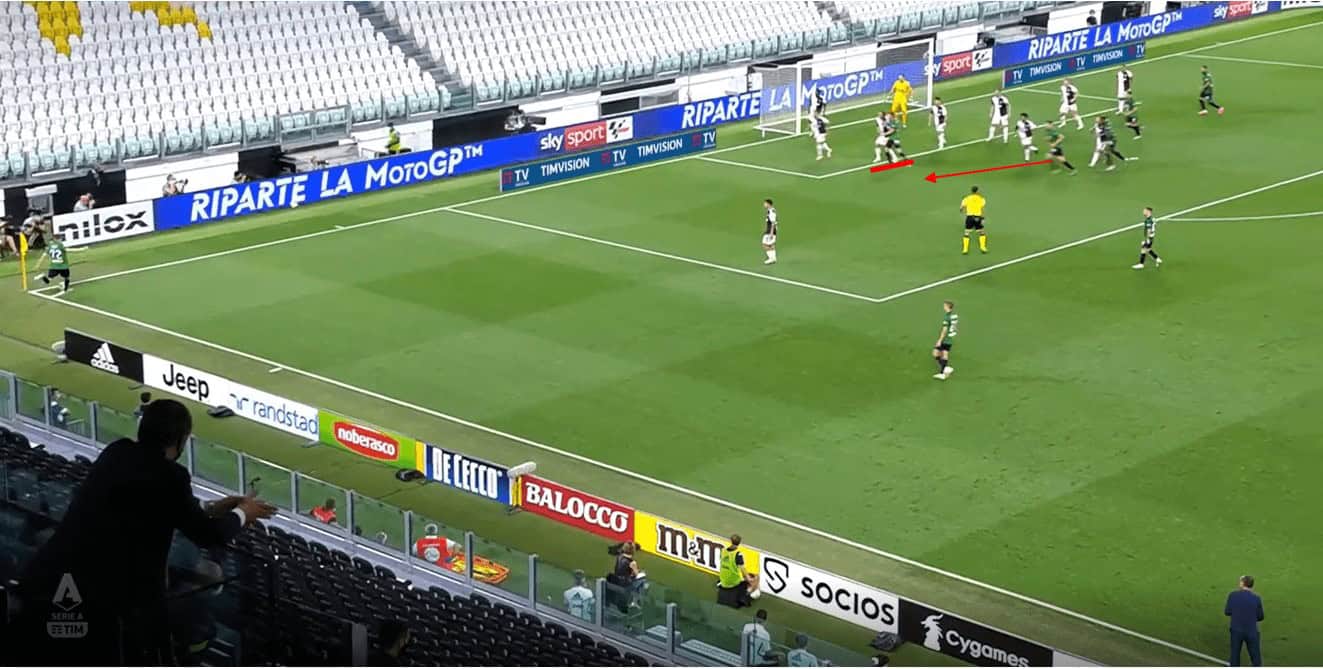
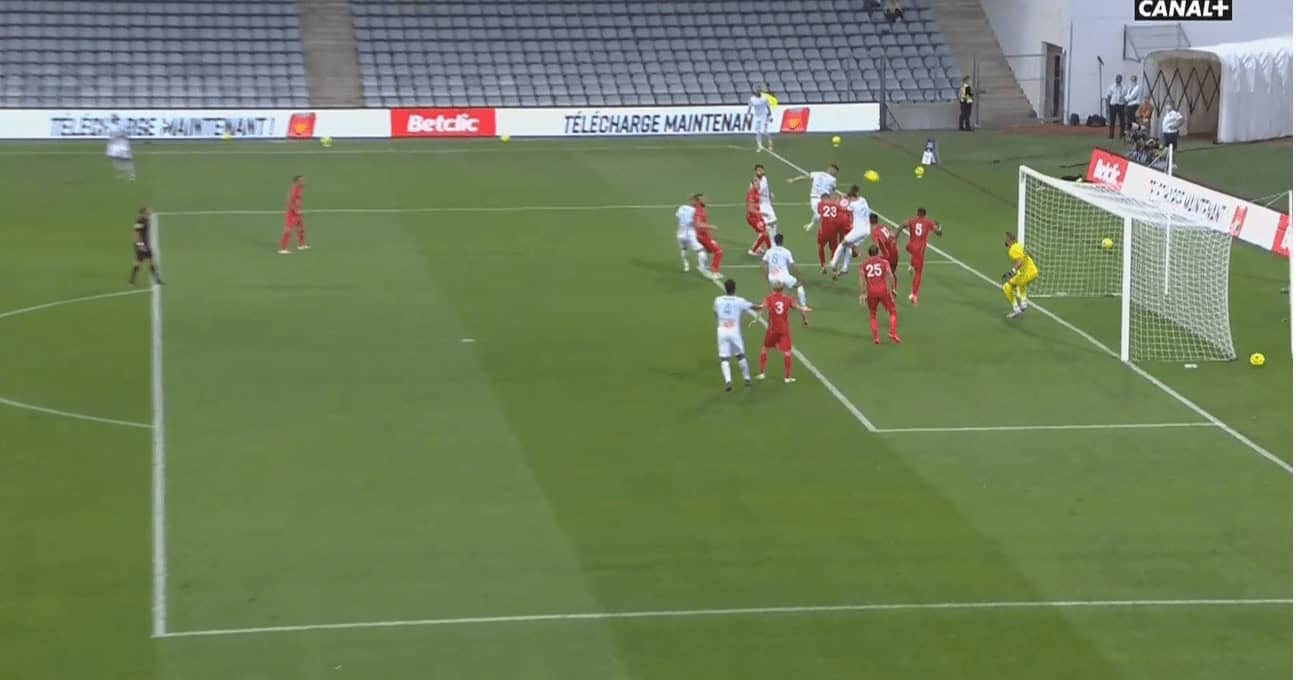
Their recent goal against Roma shows a similar trend again, with this time a blocker used intelligently against a zonal marker to allow for a near post delivery. We see Juventus again set up with two corner takers, with the outswinger used again. Roma here are very deep as a result and have two players positioned very deep at the near post to protect the lane to the goalkeeper. Two players move in a pair, with the first player moving to block the zonal player, while the deeper player acts as the target player and goes for the ball. This block prevents Roma’s nearest defender from pushing out and potentially clearing the ball.
The target player Rabiot is therefore able to reach the low delivery before any Roma players, and so he is able to flick it on for Higuaín in the six-yard box for a goal, with Roma’s zonal setup falling apart in the central area. Without the use of two takers, Roma would likely be higher here and able to reach this low delivery, but we can see Rabiot just gets there before Roma do. Also, if Roma aren’t pushed back deeper, it makes it much more difficult to receive flick ons without being offside.
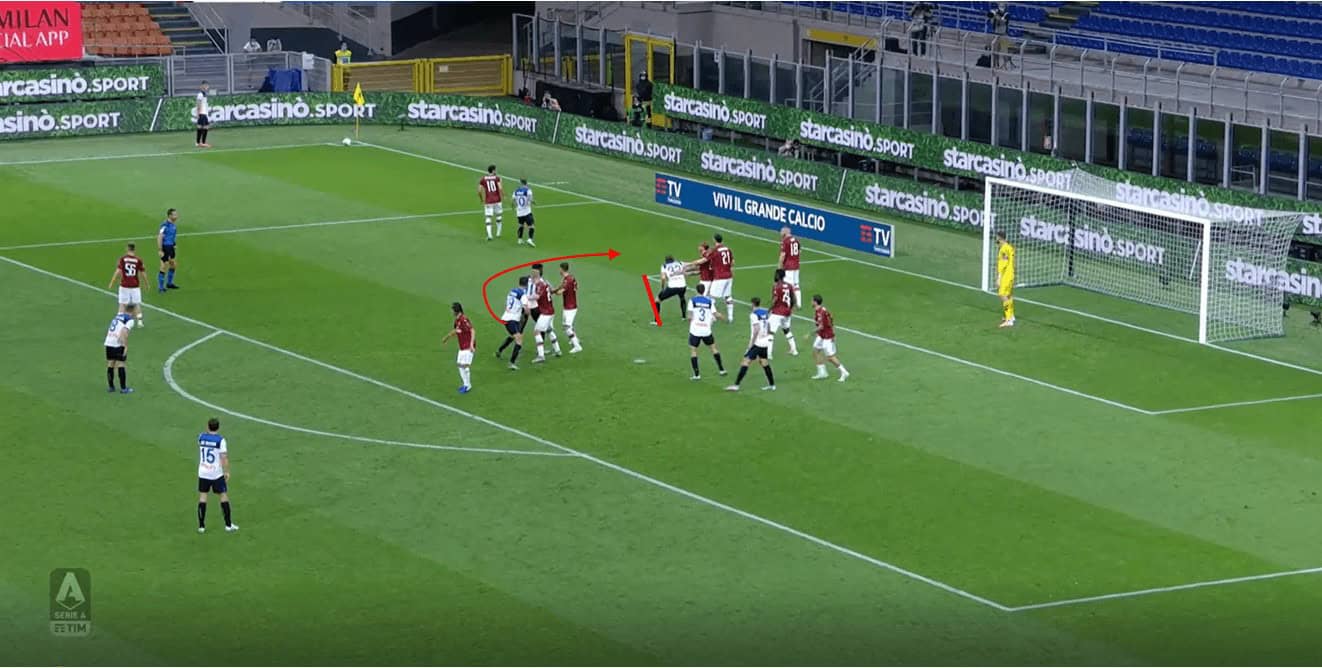
This example shows a common trend which we will see throughout the analysis, with blocking movements set up in pairs. We see Ronaldo and another player form a cluster and stay close together with their two markers. They stagger this cluster so one is in front and one is behind. Due to this staggering, Ronaldo can move out of the cluster and around his teammate, while his teammate can stand still and push backwards a bit, meaning he can block Ronaldo’s man. Again, two corner takers are used by Juventus, and so Milan have one player deep at the near post.
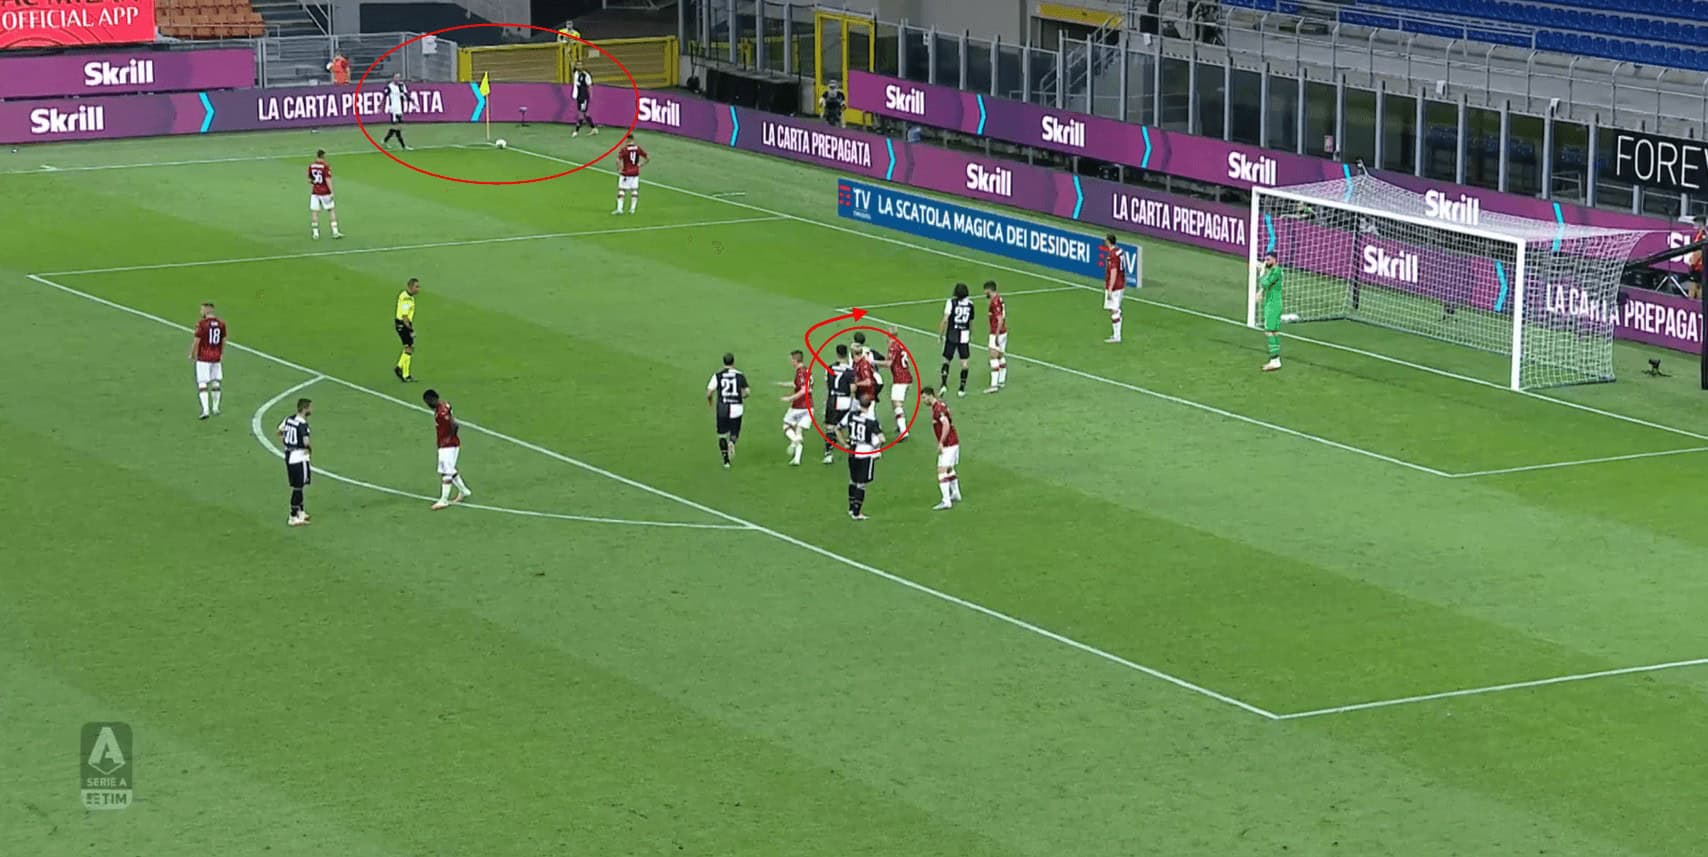
Ronaldo can, therefore, exit the cluster, and because of the near side positioning of all of Juventus’ players, Ronaldo’s run can be shielded from any Milan players. The near post player is very deep, and so shouldn’t be able to impact Ronaldo’s header. Here the delivery is slightly off and the run slightly early, but the concepts are still there to be seen clearly.
Atalanta
Atalanta have created good situations from corners this season, but due to the sheer number of opportunities they have had, it would be fair to label them inefficient. For the purposes of the article though, they give some good examples of near post movements.
One of the most common movements used around the near post is the blindside run, which we see often in Arsenal and Marseille’s sections too. Blindside runs are runs made by an attacker from behind or out of sight of a defender. They start their runs out of sight, and if done correctly, will arrive into space just as the ball is delivered. This means that because defenders can’t see the run being made, they struggle to either pick up the run in the first place or correctly time their movement against the attacker.
We can see an example of this below, with a player starting behind the near post zonal player and arriving into the space in front. Because the defender cannot see the attacker, their timing of a movement forward becomes difficult, in that, if they go too early they increase the space in behind, and if they go too late they will miss the header. Furthermore, because the Atalanta player runs from further away, they get a run-up and have a dynamic advantage over the defender.
As a result, Atalanta get a relatively unchallenged header in a good area, with little coordination and only one player needed to execute it.
We can see an example here where an early decoy run is used to create that space in behind. The nearest player makes an early, readable run towards the taker, which drags a zonal marker wider and increases the space behind him. Atalanta then coordinate a run into this space, but the player makes no kind of dismarking movement, meaning his header is challenged by the player marking him.
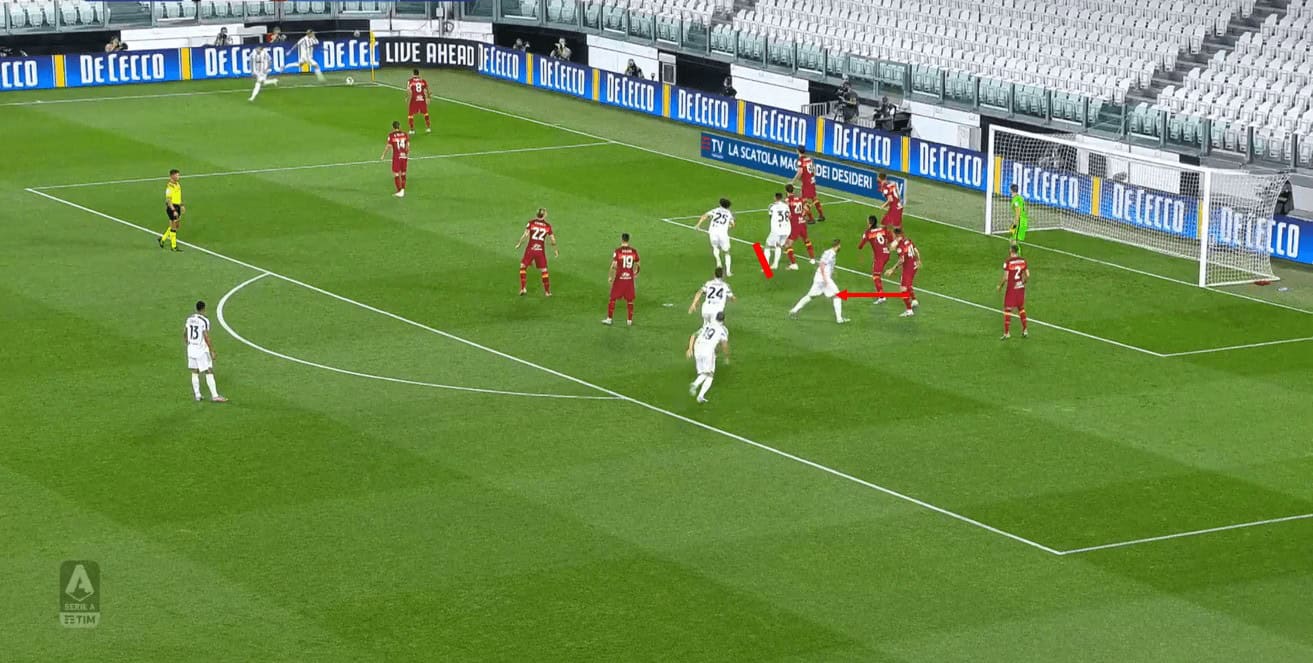
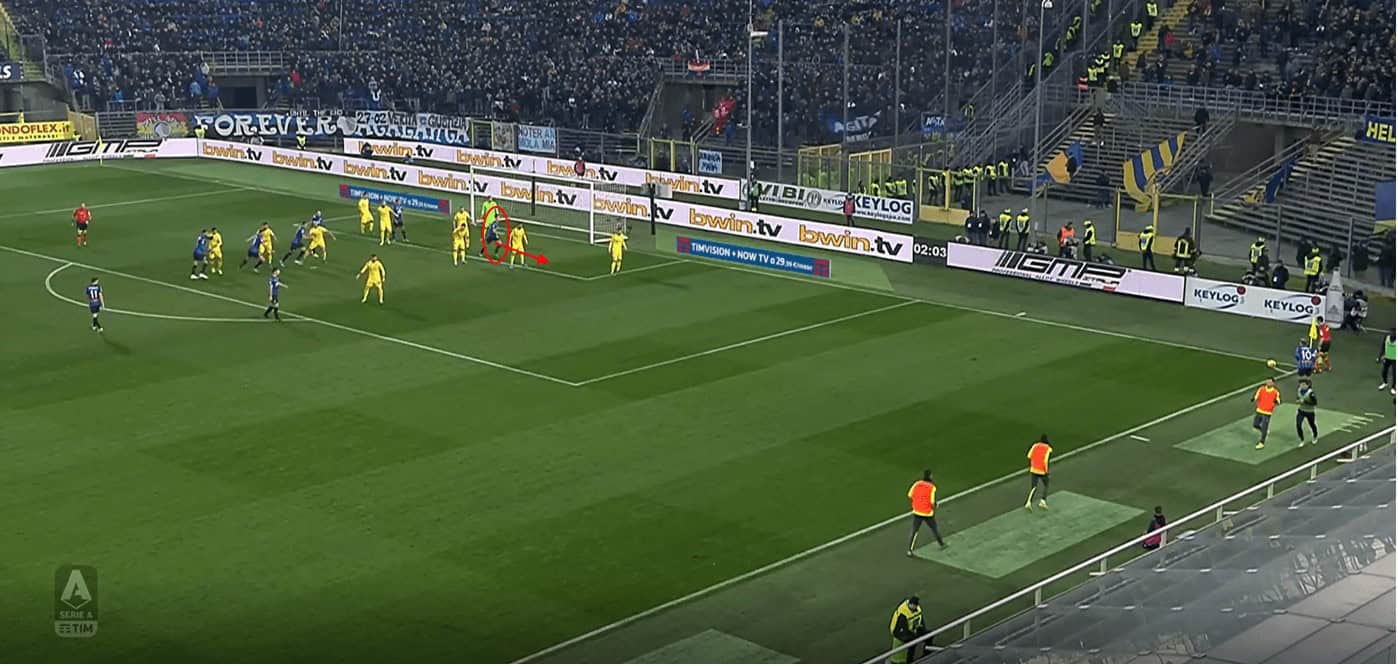
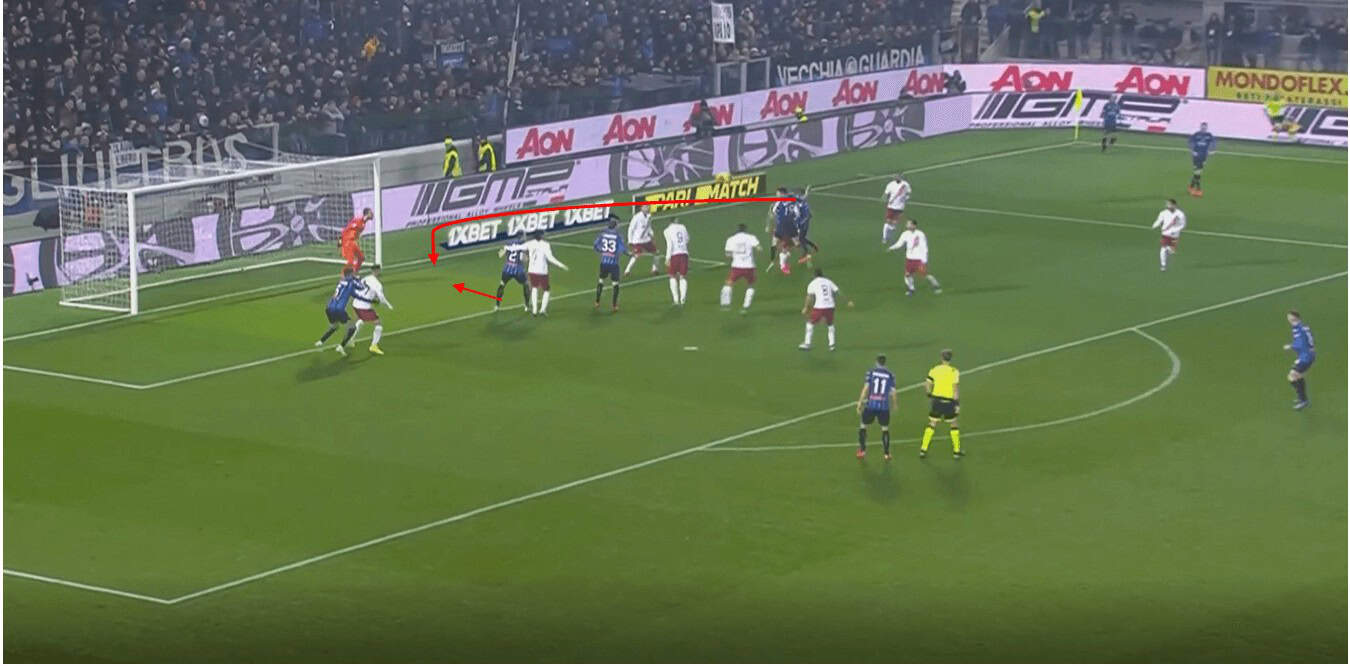
This example combines multiple trends into one scene and a goal is scored. We see a decoy movement is made towards the taker to drag markers forward, while a block is placed on the nearest zonal marker. A deeper run is then made towards this space that is blocked off and made bigger by other players movements.
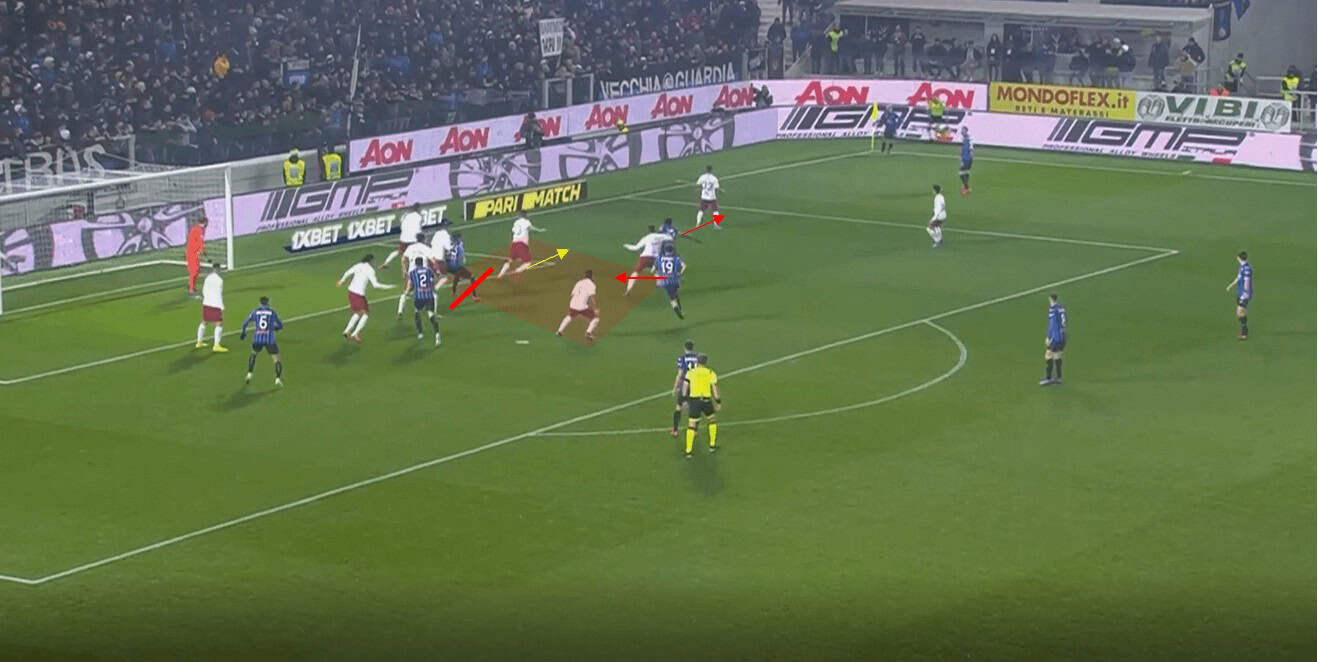
Atalanta’s number 19 (Berat Djimsiti) is therefore able to win the header in this zone. Atalanta have also prepared their structure well to receive a flick-on, and so a player gets goalside of the Roma defender to score.
Here we see Atalanta try a very similar movement to Juventus, with a two-player pair forming a cluster while a zonal player is blocked at the near post. Both of those examples have been against AC Milan incidentally, and AC Milan’s structure clearly leaves itself open to near post deliveries, which is a rare occurrence in Serie A. Again, out of the two-player pair, the deepest player runs around the block to allow the front player to block. The delivery here though is poor, and the blocker does not do a good job of blocking the player, and so AC Milan clear.
We can see a similar basic idea here, with Atalanta using one blocker on a zonal marker at the near post. A runner then moves from deep and moves just in front of the block for a free header. Outswinging corners are often used against zonal systems in order to access deeper areas, and we can see this in use here, with the block not allowing Juventus to push out.
Juventus’ man markers don’t follow the Atalanta attackers strictly, and so they get a free header in a deeper near post area worth 0.10 xG. The header is a poor one and doesn’t get the lift required, and the opportunity for a flick-on towards the back post is lost.
Marseille
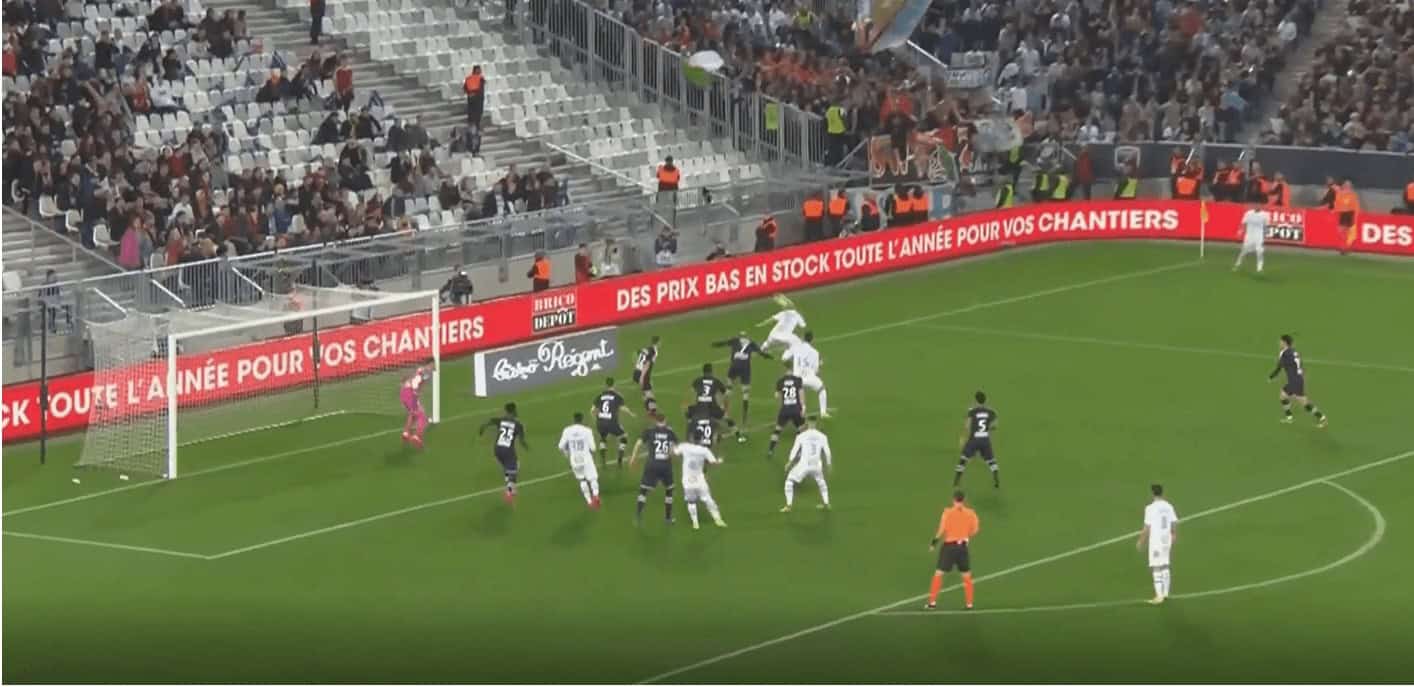
Marseille have generated a total of 1.0 xG from 15 shots from the near post zone this season according to Wyscout data, and the majority of these chances have been created through the use of blindside runs. We can see a fairly uninventive but effective example here, with striker Valerie Germain standing behind two defenders.
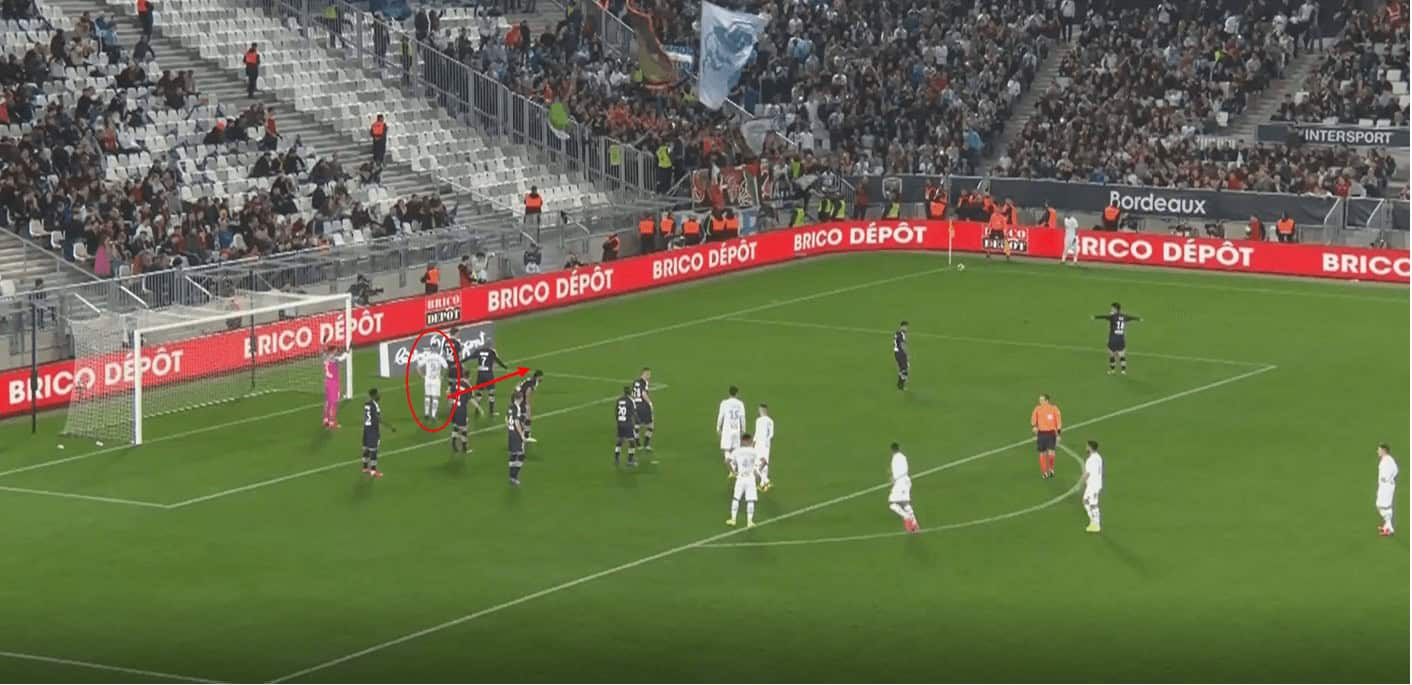
Germain times his run well, and the delivery meets the run to allow Germain a header just in front of those defenders, who can’t get close enough and react due to both Germain’s positioning and the speed of his run.
In very recent friendlies though, Marseille have continued their trend of targeting the near post, and have added some more clever movements to blindside runs. Here we see the target player starts in a cluster of two at the back post. One player acts as a blocker and prevents the target man’s marker from following. This target player moves from the back post and through the zonal system towards the front post.
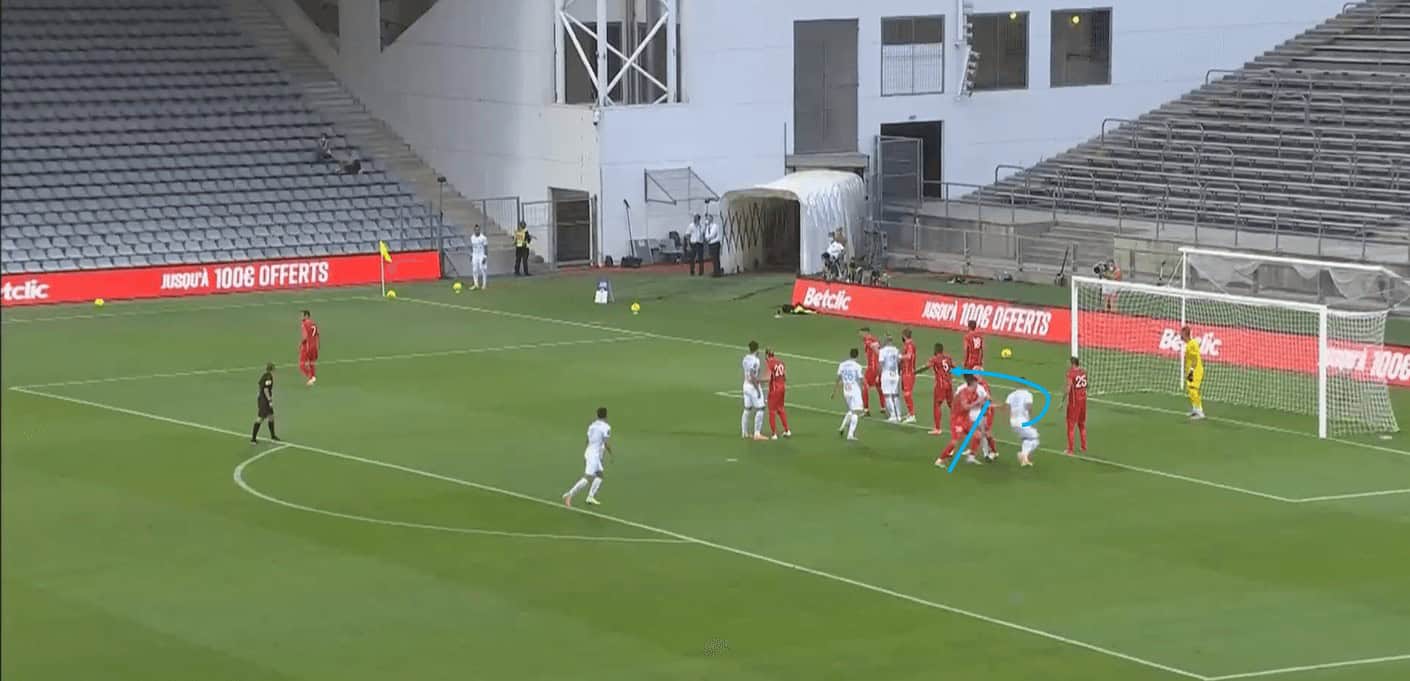
This gives the player even more of a dynamic advantage over defenders at the near post, and also doesn’t allow for the player to be man-marked as they make the blindside run, which is a defensive adaptation some teams may use. The header is saved by the goalkeeper and goes down as a 0.17xG chance.
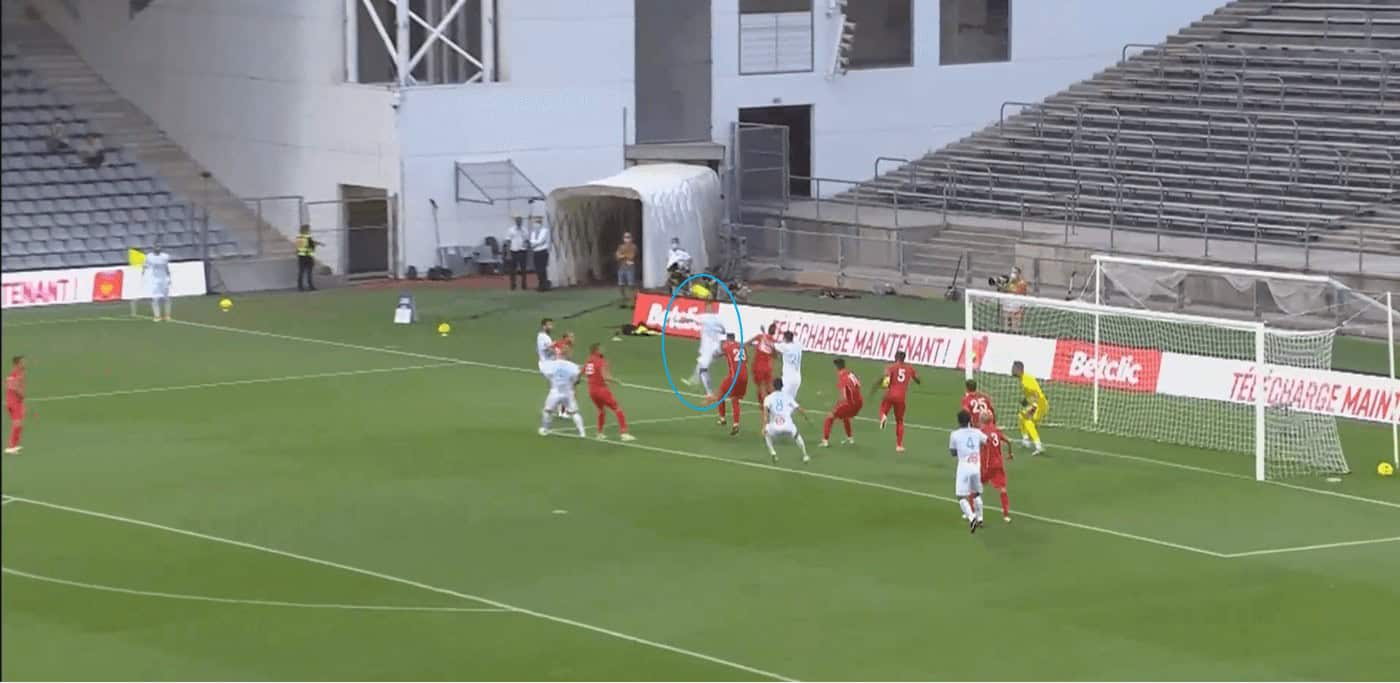
We can tell this is something Marseille have clearly been working on, as they did this twice in the same game, both times with the same result (0.17 xG shot). We see this time the player starts on the near side of his marker and moves centrally, before then moving towards the near post just as the ball is about to be delivered.
As a result, again we can see the dynamic advantage the attacker has, with no players rising close to the height he achieves. When performing this kind of movement, it is also vital Marseille’s spacing between players is good, as if Marseille commit players into the central areas here, they may drag the opposition back and create traffic for the target player, making it harder for him to reach the near post.
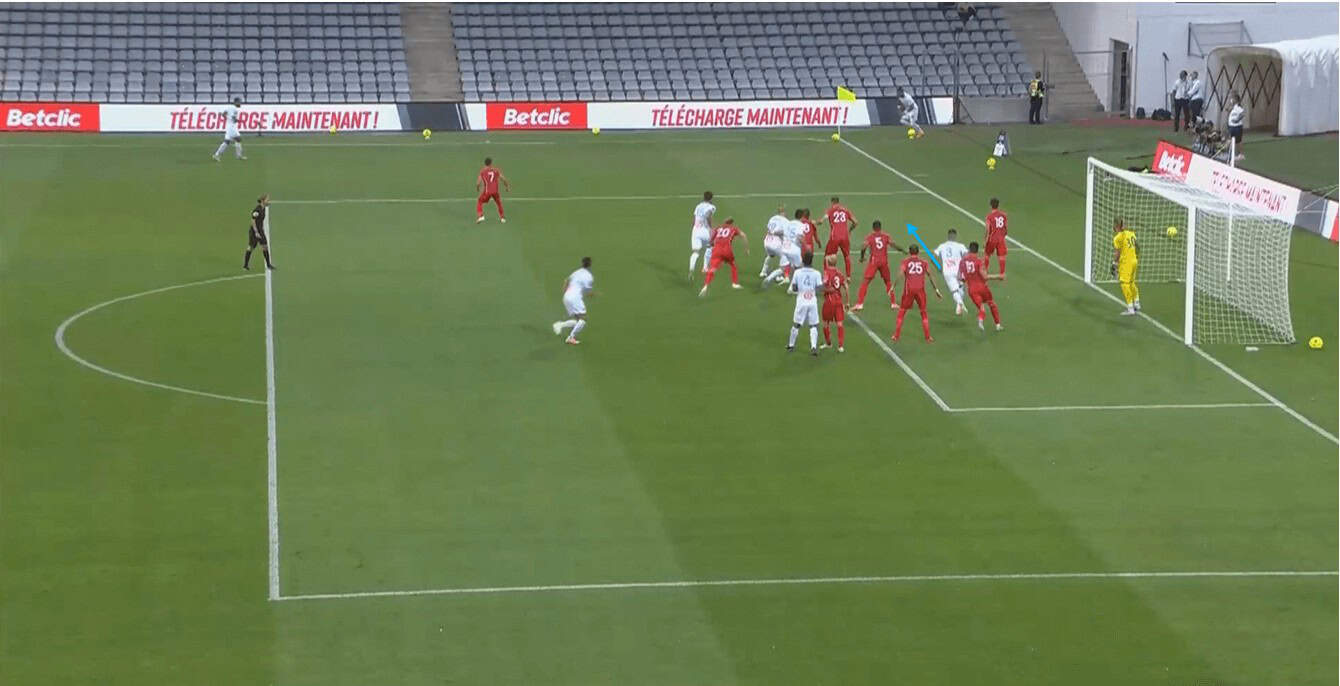
It is handy then, that Marseille also show a good understanding of spacing, which is demonstrated well in this near post goal. This example is a similar example to those decoy runs we mentioned previously, as we see two players making complementary movements. One player moves past the near post aggressively, while another makes a run between the zonal spacing of the opposition defenders. The first run stretches the zonal defence of Lille, and as a result, allows the second runner more space.
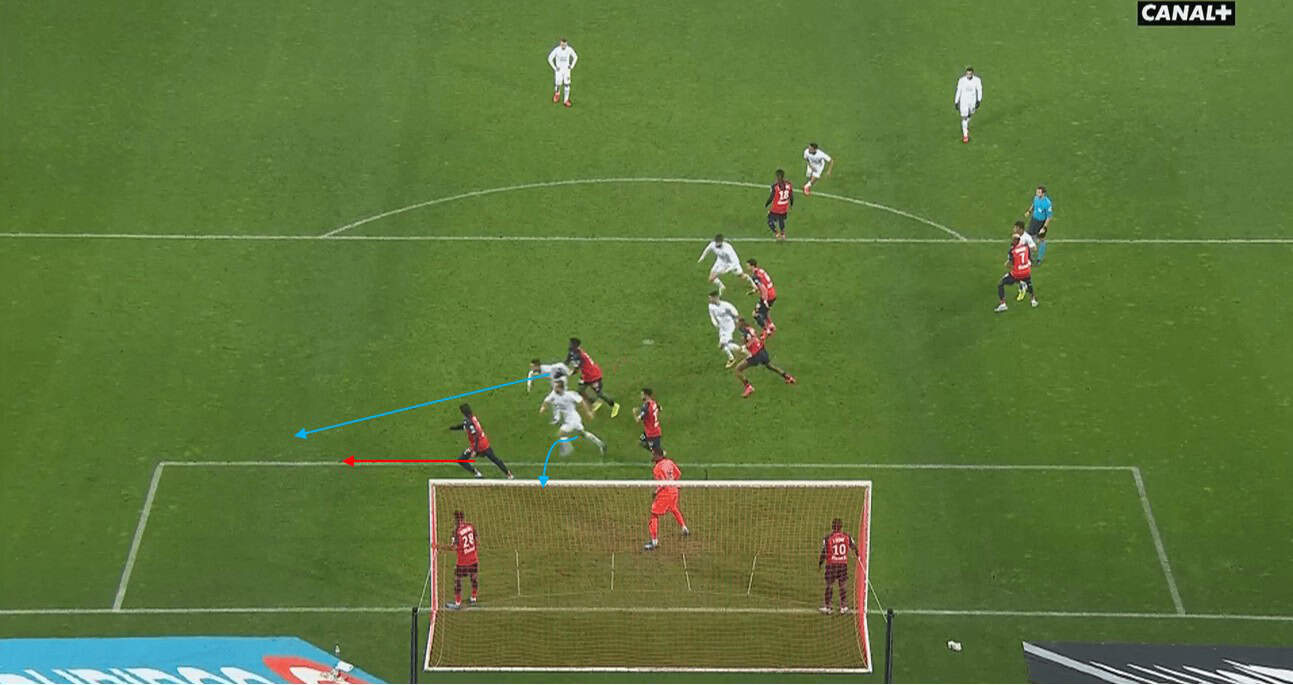
We can see then that Lille’s near post zonal marker has been stretched right out and is now marking that decoy player, while Germain (second runner) remains spaced equally between the two zonal defenders and can, therefore, have a free header.

Arsenal
The final team we will look at for near post deliveries is Arsenal, who have totalled 61 deliveries and 1.13 xG. Arsenal again follow similar trends, with the near post blindside run often used in their goals scored.
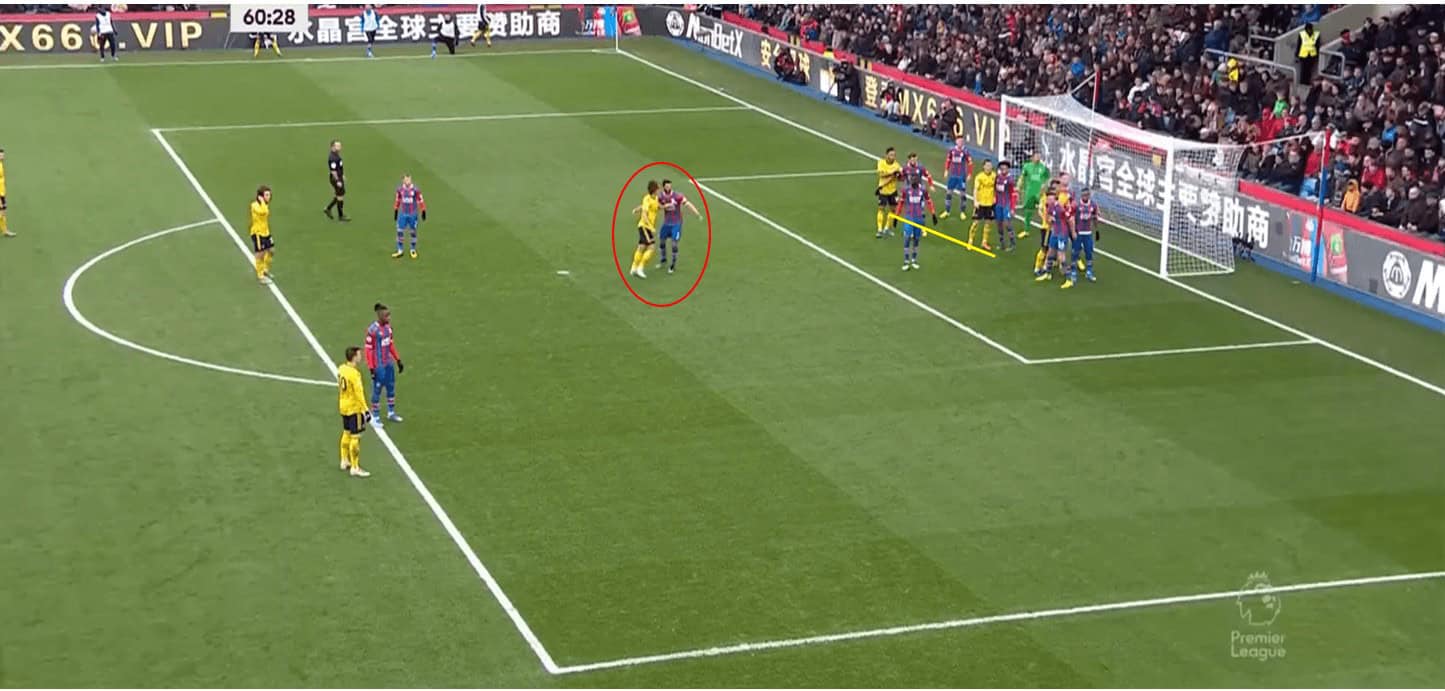
This example though shows a nice variation leading to a relatively high xG chance, although Arsenal could do better. We see Arsenal prepare an inswinging corner and crowd the space around the goalkeeper, while David Luiz starts deeper alone. This high positioning from Arsenal’s players, as well as the inswinging delivery, forces Crystal Palace to drop deeper. David Luiz uses a technique here which may seem simple but we will talk about a lot later in this series of articles- his hands. Luiz uses his hands and arms as a way of creating dynamic advantage over his marker, as he pushes off his marker to gain a few steps. We will talk about this more with some Reggie Miller and NBA comparisons.
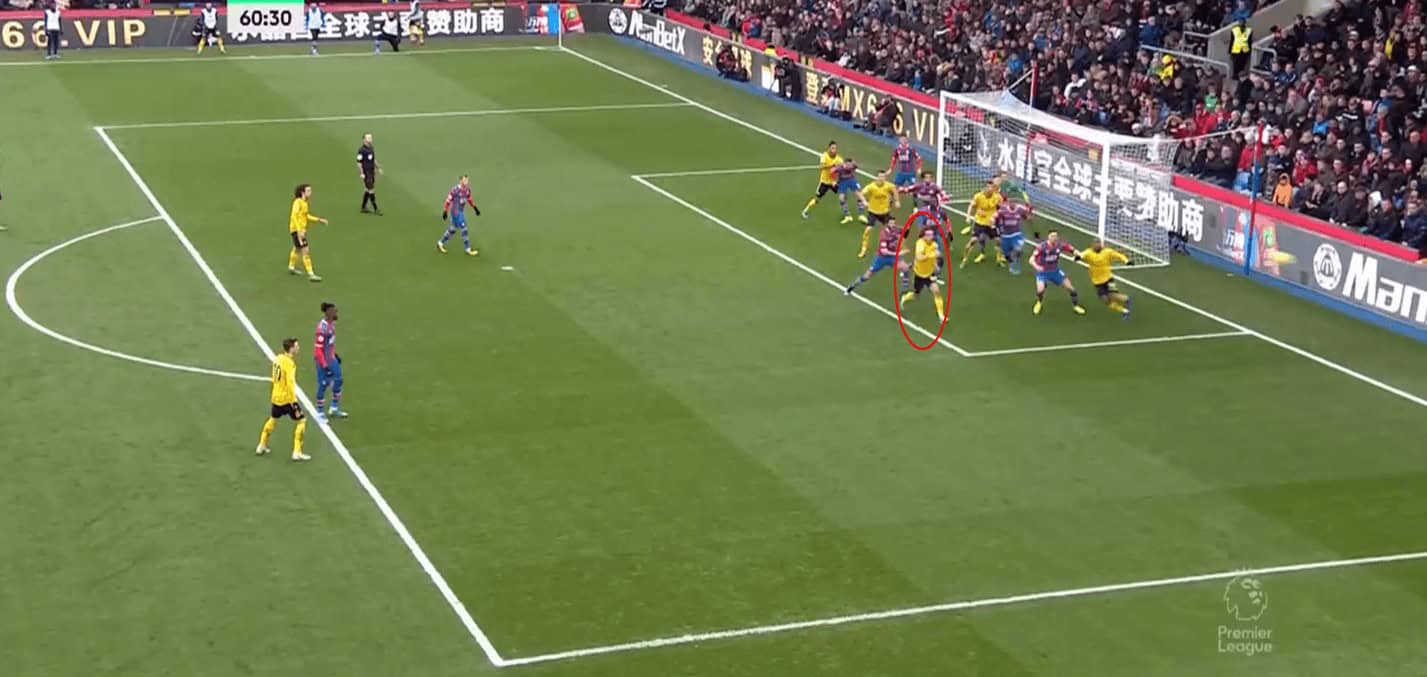
Because of the simple push-off, we see Luiz is able to gain a yard on his opponent as he runs to the near post, and the deeper structure of Crystal Palace means it is difficult to push out and reach the delivery. Lacazette here makes a blindside run behind his defender, but because he isn’t the target man, he actually helps Crystal Palace get closer to Luiz. The header goes just over the bar, with Wyscout classing this as a 0.20 xG chance.
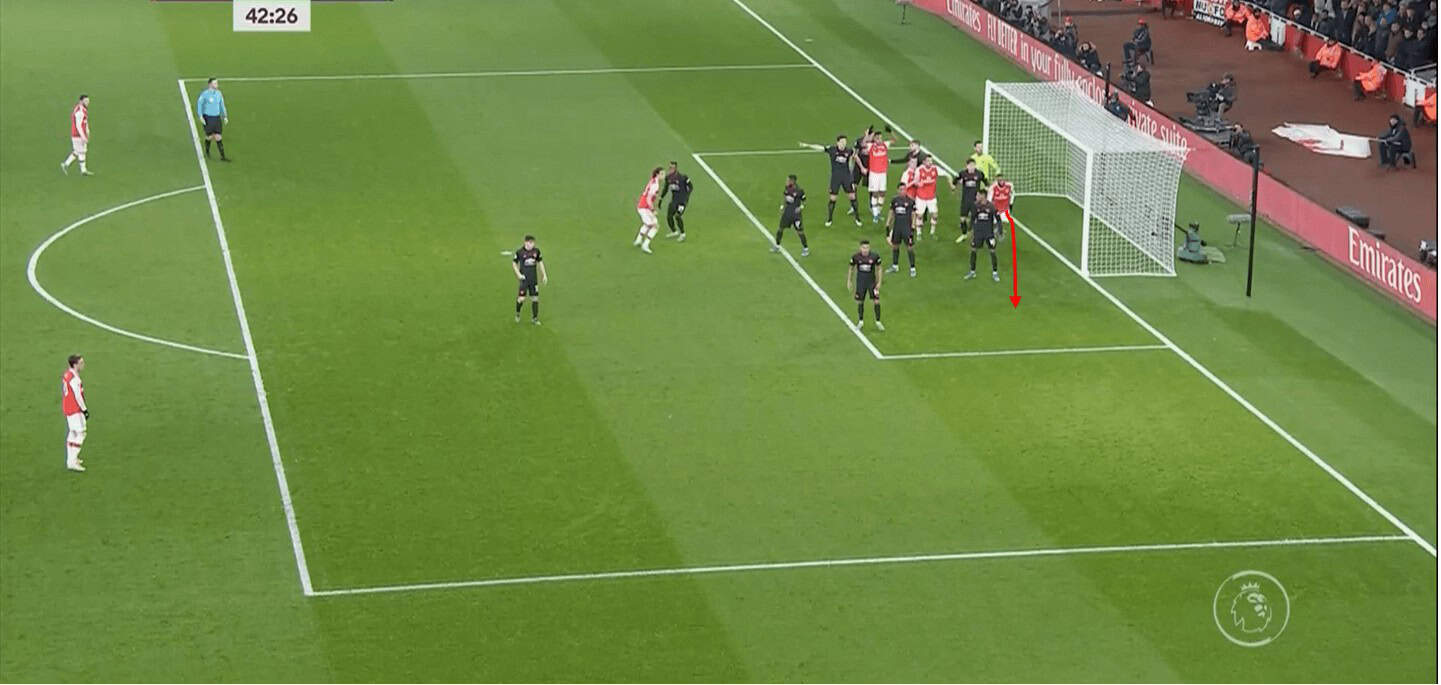
This goal against Manchester United earlier in the season comes as a direct result of a blindside run from Lacazette, with Arsenal again forcing the opposition deeper with their structure and method of delivery. Lacazette makes a simple move through United’s zonal system, and times his movement well so that he arrives in front of the near post zonal player just as the ball arrives. United’s structure is slightly too compact and could allow for more spacing at the near post which would help them to defend, but Arsenal create this issue.
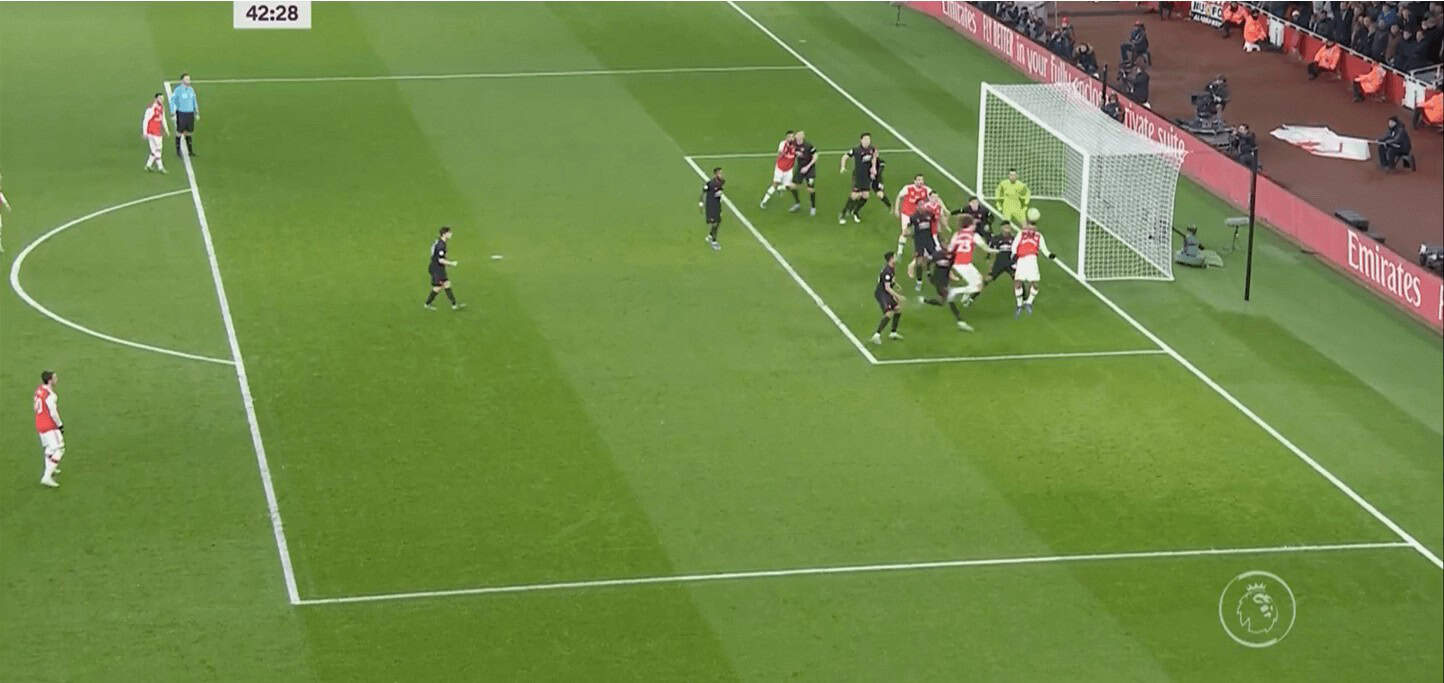
Lacazette is then able to win the header under no real challenge from a Man United player, and he flicks the ball on towards goal. The header is saved by De Gea, but due to Arsenal’s structure it is able to be bundled in by Sokratis for a goal. Arsenal used this often earlier in the season, with their pre lockdown game against Manchester City featuring many blindside runs from corners.
Conclusion
To summarise the article into a few ideas, the most successful teams around the near post use:
- Blockers on near post zonal markers to reduce defensive coverage
- Blindside runs to create free headers
- Decoy movements to manipulate zonal spacing
- Blocking movements in pairs
- Use the method of delivery to their advantage
This piece is the first of a series, which will also be released as a whole, on offensive set-pieces in Europe’s top five leagues. This piece should, therefore, have reviewed who the best teams are in the near post zone and the trends in their behaviour and tactics. Of course, not every team has been included in this analysis, but the teams chosen were chosen on the basis of the number of shots they had, the number of goals, as well as xG and deliveries which are accounted for in the graphs. At the end of the series, I will likely revisit teams to analyse their whole set-piece game in more depth. Any mistakes in data can be accounted for due to the amount of footage watched, and so if a team perhaps doesn’t perform as well as the data suggests, this is picked up through footage, as was the case with Nantes in this article. Expected goals in the near post zone are fairly low in Wyscout’s data, and this is possibly due to tracking data classing some headers in other zones, however again, with every corner watched of the teams in this analysis, the trends seen are clear and valid.