In our February magazine article entitled, “College Soccer: NCAA D1 game model clustering and KPIs derived by machine learning,” we investigated the questions, “How does our game model relate to other programs? And who with a similar game model is pulling it off better than us?”
By reverse-engineering KPIs, we determined which metrics were most important for programs within four general styles of play to track.
In this article, we’re after a different question. If the previous article asked “who plays like us, but better,” this article asks, “which style best suits college soccer?”
We’re headed in a few directions to answer that question.
First, we do want to visualise performances through a team context, distinguishing each cluster. Second, we’re adding RPI to the mix, which is an NCAA means of weighing results to better assess the strength of a team. We’ll then look at cluster-generated data before finishing with an investigation of NCAA tournament results.
Visualising cluster performances through team results
If you haven’t read the NCAA D1 men’s soccer data analysis we published in our February magazine, that’s an important reference point. In that article, we used a clustering technique that weighed event data to break each D1 team into one of four clusters. Those groups represent similarities in playing style. It’s not to say that the game models are exact, but it does point to a high degree of similarity in the way each team approaches the game.
To give a basic description before launching into this analysis, think of Cluster 1 as a Barcelona-type team. The playing style is highly identifiable and correlates with higher percentages of possession and an aggressive high press. In this article, they are represented with filled pink circles.
Cluster two is more synonymous with an adaptable style of play. From game to game, they may have more or less with the ball, press higher or slightly deeper and may rely on the counterattack more for some opponents and less for others. Think of the Real Madrid teams in recent years. They could enjoy 70% of possession against Cadiz and just as easily have 46% as they did against Liverpool in the 2022/23 UEFA Champions League final. They have clear principles of play, but they also show no fear of adapting to each opponent. In this analysis, Cluster 2 is featured in an unfilled pink ring.
Cluster three is a good fit with Atlético Madrid. There’s a reputation for less possession and a greater prioritisation of defensive solidity, but they’re also dangerous when they do get the ball. They use their defensive approach to optimise their attacks to create space to counterattack. Cluster 3 has been assigned an unfilled yellow ring.
Speaking of Cadiz, they make an exemplary model for Cluster 4. Think a very rigid defensive side that has a clear assignment. They’re going to sit deeper, often in either a low block or a deep mid-block, while relying almost exclusively on counterattacks and set pieces for their goals. 1-0 is a fantastic result. You’ll find them in this analysis with a filled yellow circle.
Let’s start with a listing of each cluster to give a sense of representation across NCAA D1 men’s soccer. The first cluster, our more possession-dominant and high-pressing teams, are the least representative. They’re followed by the second and fourth clusters. That third group is the most common style of play, relying on defensive security and attacking transitions to execute their game model.

So, how did these teams perform in 2023?
Perhaps it’s not the biggest surprise to see a linear progression from the bright yellows, Cluster 4, in the bottom left to the bright pinks, Cluster 1, in the top right. What’s more interesting is how those two middle groups fare. Marshall, West Virginia and Bryant had exceptional seasons and can make an argument that their regular season performances were top five in the nation. Cluster 2 has some representation in the bottom left quadrant, showing poor results, but most of the group sits in the top right.
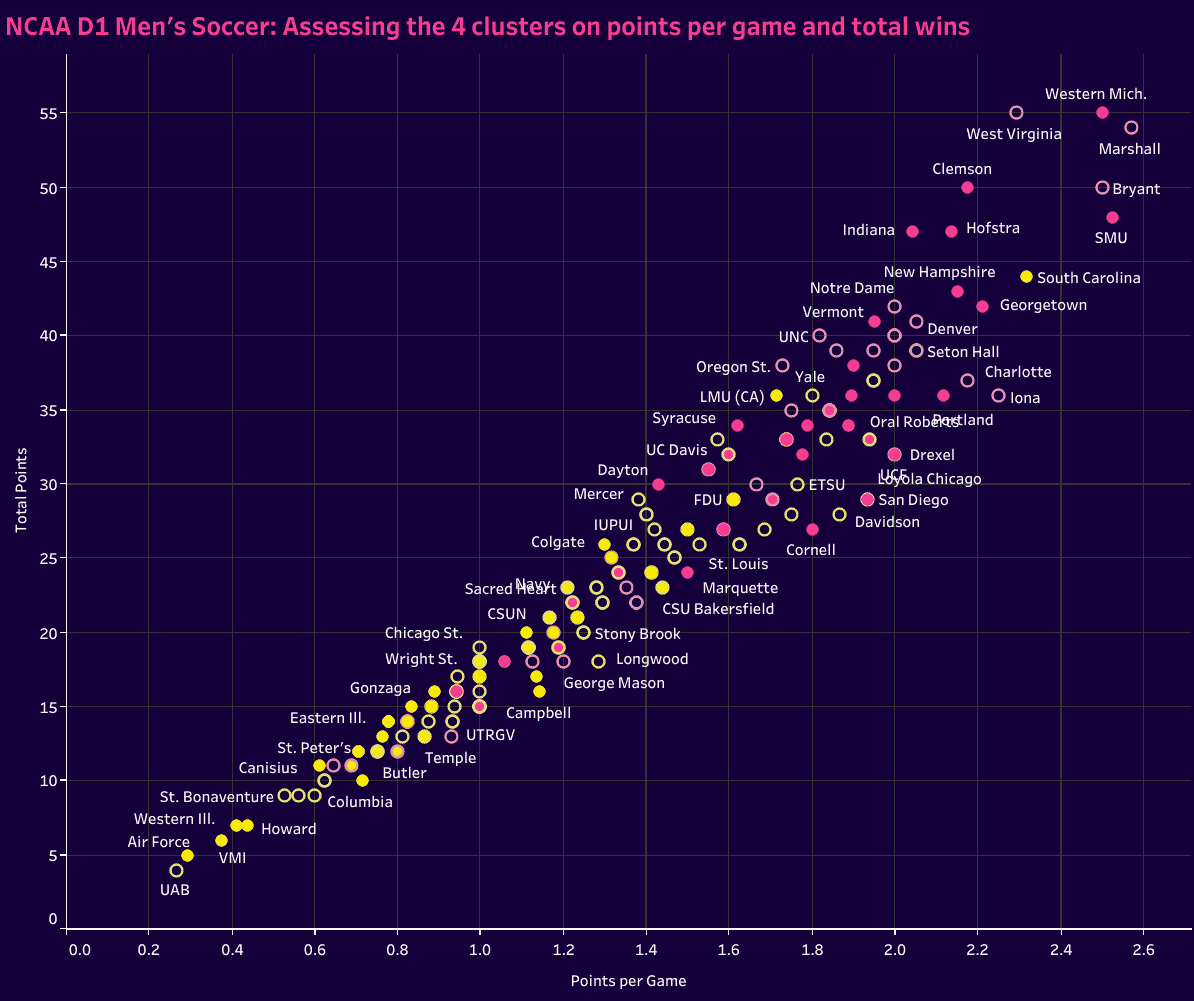
Group three is very much a mixed bag. For the most part, they sit in the middle of the chart with a few exceptions pushing into the top right quadrant but more numbers falling to the bottom left.
Loyola Marymount University (LMU) Is the one exception from group four to make the top right.
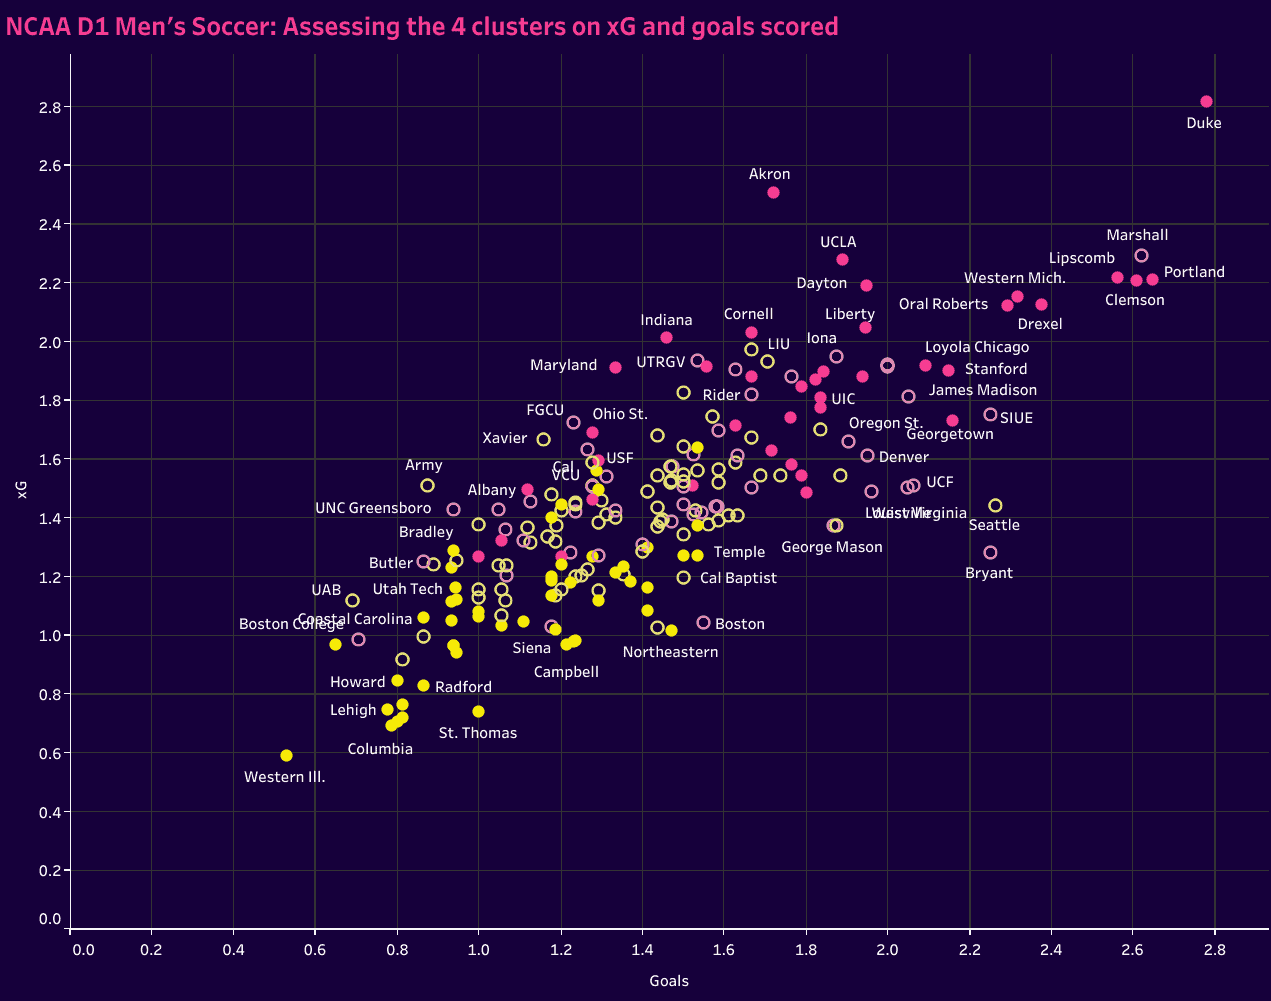
Turning to goals scored and xG, Cluster 1 dominated the top performers list while Cluster 4 steadily brought up the rear. Group three ranges from slightly above average to a little below average.
The last graph in this section turns to the other side of the pitch, assessing goals against and xGA. Once again, Cluster 4 falls into the bottom left with a few exceptions.
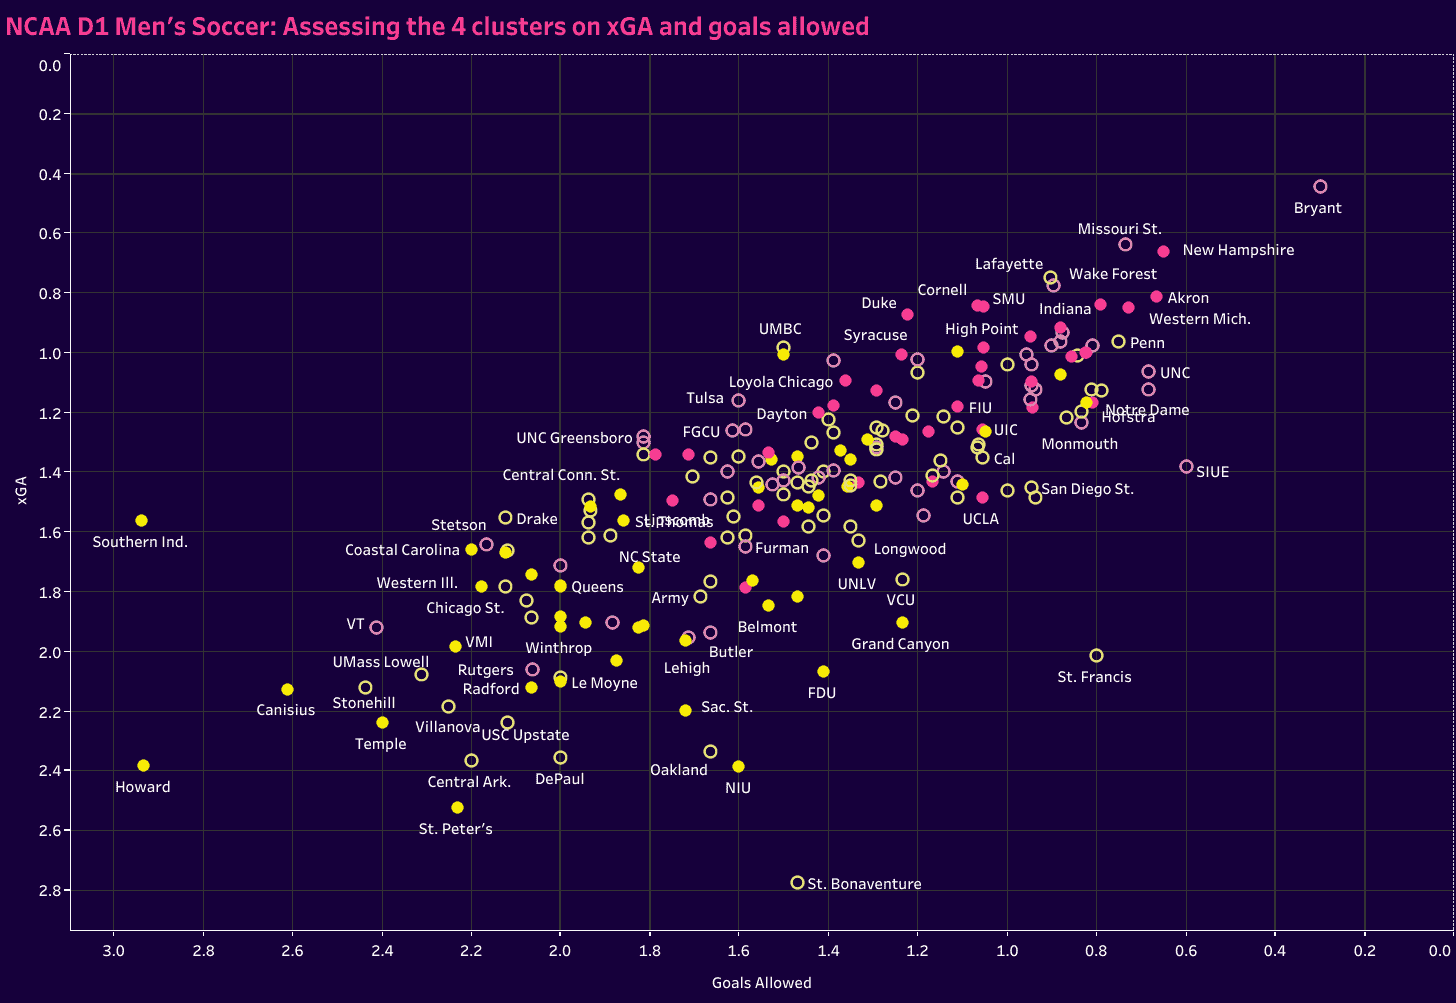
On the top right, there is an initial, strong presence from the two pink groups, but certainly more yellow interspersed. As we scale to the middle of the chart, there’s a near-equal representation among pinks and yellows. Finally, in the bottom left, we find the teams from clusters one and two that struggled on the defensive side of the ball. Whether due to poor rest infrastructure leading to successful opposition counterattacks, set pieces against or poor execution of their press, these teams fell significantly from the areas of the chart with high concentrations of pink teams.
Cluster representation in the RPI ratings
Data relating to points and goals, both for and against, gives us a good sense of the performances over the course of the season. That said, NCAA soccer is unique because it has an RPI rating system to help balance stronger and weaker conferences. For those unfamiliar with college soccer, a dominant team from one of the lowest-rated conferences may very well struggle with a more difficult schedule.
To frame it a little differently, imagine EFL Championship and League 1 teams playing Premier League clubs in cup games. Some will have more success than others, as there’s a wide range of talent across those two lower leagues. RPI ratings balance strength of schedule and results against different tiers within the college system. It’s designed to give us a better sense of a team’s level relative to the field.
Our first chart in this section positions teams with their points per game related to their RPI rank. RPI will rate teams from #1 in the nation to #211. We can see here how points per game don’t necessarily correspond to a higher overall RPI rating. The quality of the wins matters.
![]()
We can also see the colour dispersal across the chart. The top right is dominated by the first three clusters, with one and two being especially prevalent at the uppermost reaches.
Taking the season totals from each cluster and working out averages, we get a sense of each group’s average points per game and RPI rank over the course of the season. The linear progression from Cluster 4 on the bottom left of the grouping to Cluster 1 on the top right is preserved.
![]()
We can also look at median RPI and average rating to frame it slightly differently. Again, the more possession-dominant a team is, the higher they tend to rate.
![]()
Everyone in college soccer knows that there are the “haves” and the “have-nots.” Some have the full allotment of 9.9 athletic scholarships on the men’s side; others have a portion or none at all. As one Power Conference assistant coach put it, his university was the “have-nots of the haves.” Several mid-majors fall into the category of “haves” as well, boasting world-class facilities and a professional grade staff.
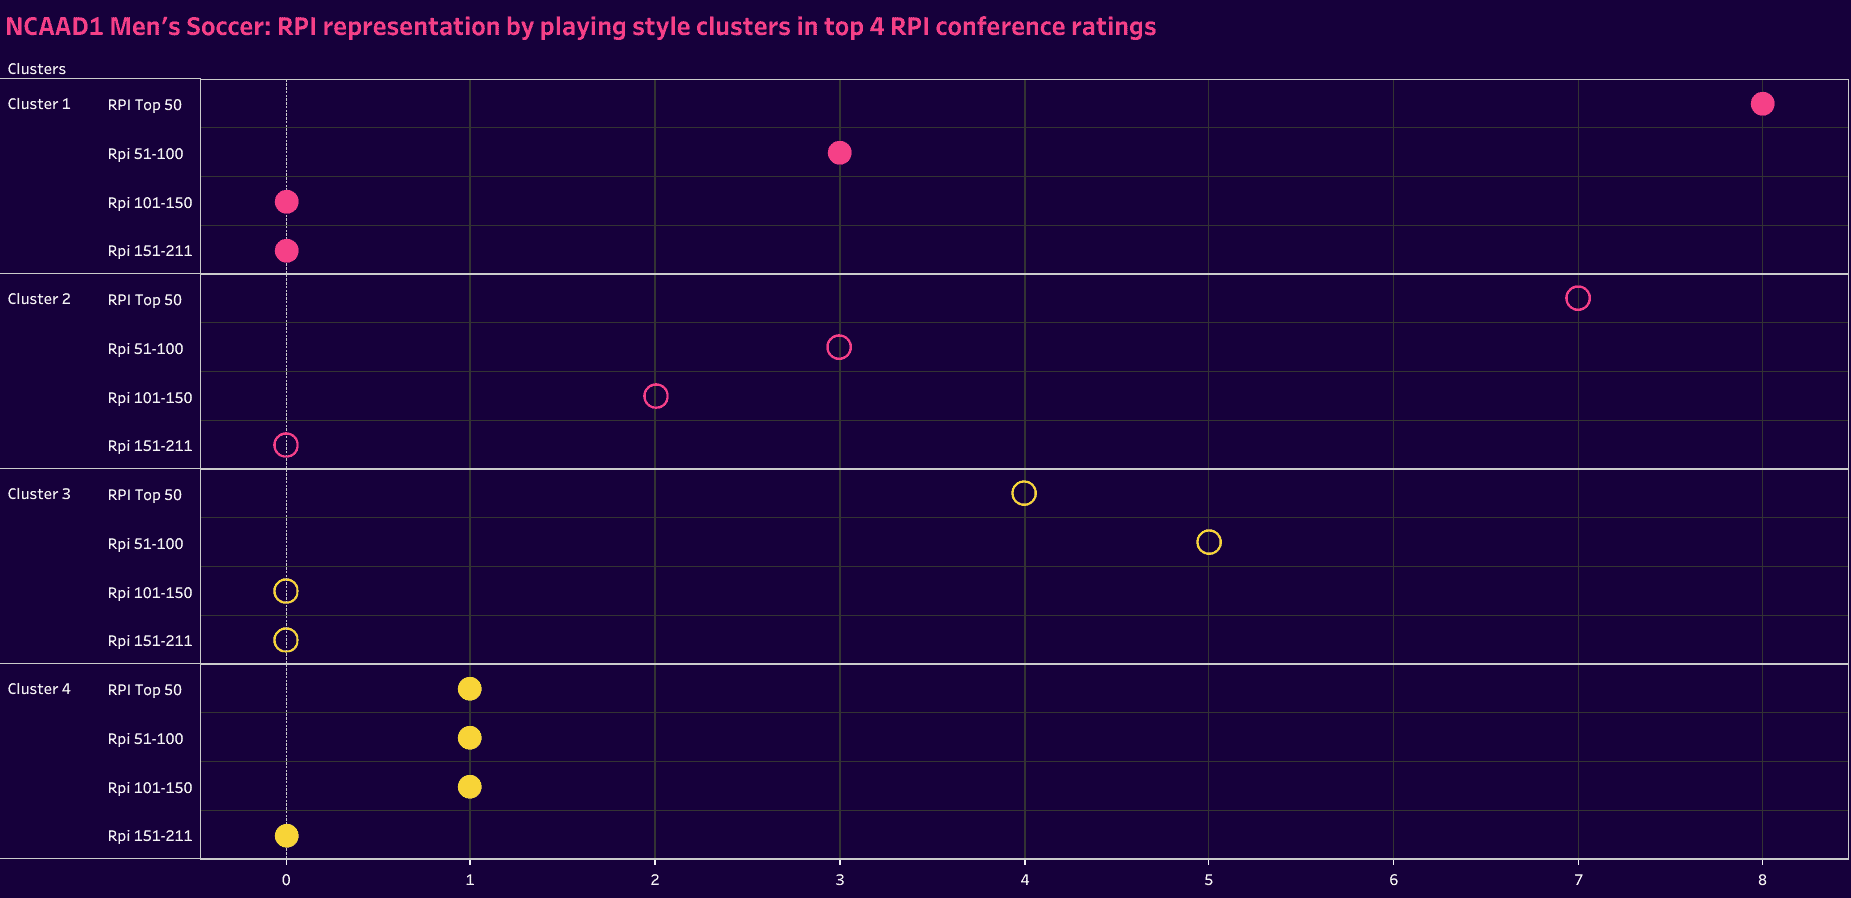
To look deeper at the distinctions between the Power Conferences and everyone else, we’ve sorted the data to segment the top four conferences in RPI (PAC-12, ACC, the Big West and Big 10) to see if there are any distinctions worth noting in the playing styles. Although the Big West is more traditionally considered a mid-major, their conference RPI rated higher than the Big 10, which is why they are included in this group.
Within the top four RPI conferences, there was very little difference in the median team rankings between Clusters 1 and 2. Group 3 rated a ways off, while Cluster 4 teams were well off the mark.
![]()
Interestingly, while the median difference between Clusters 1 and 2 was very similar, the former performed much better in average rating. Cluster 3 teams rated higher than Cluster 2 in median rank, which is the surprise on the graph.
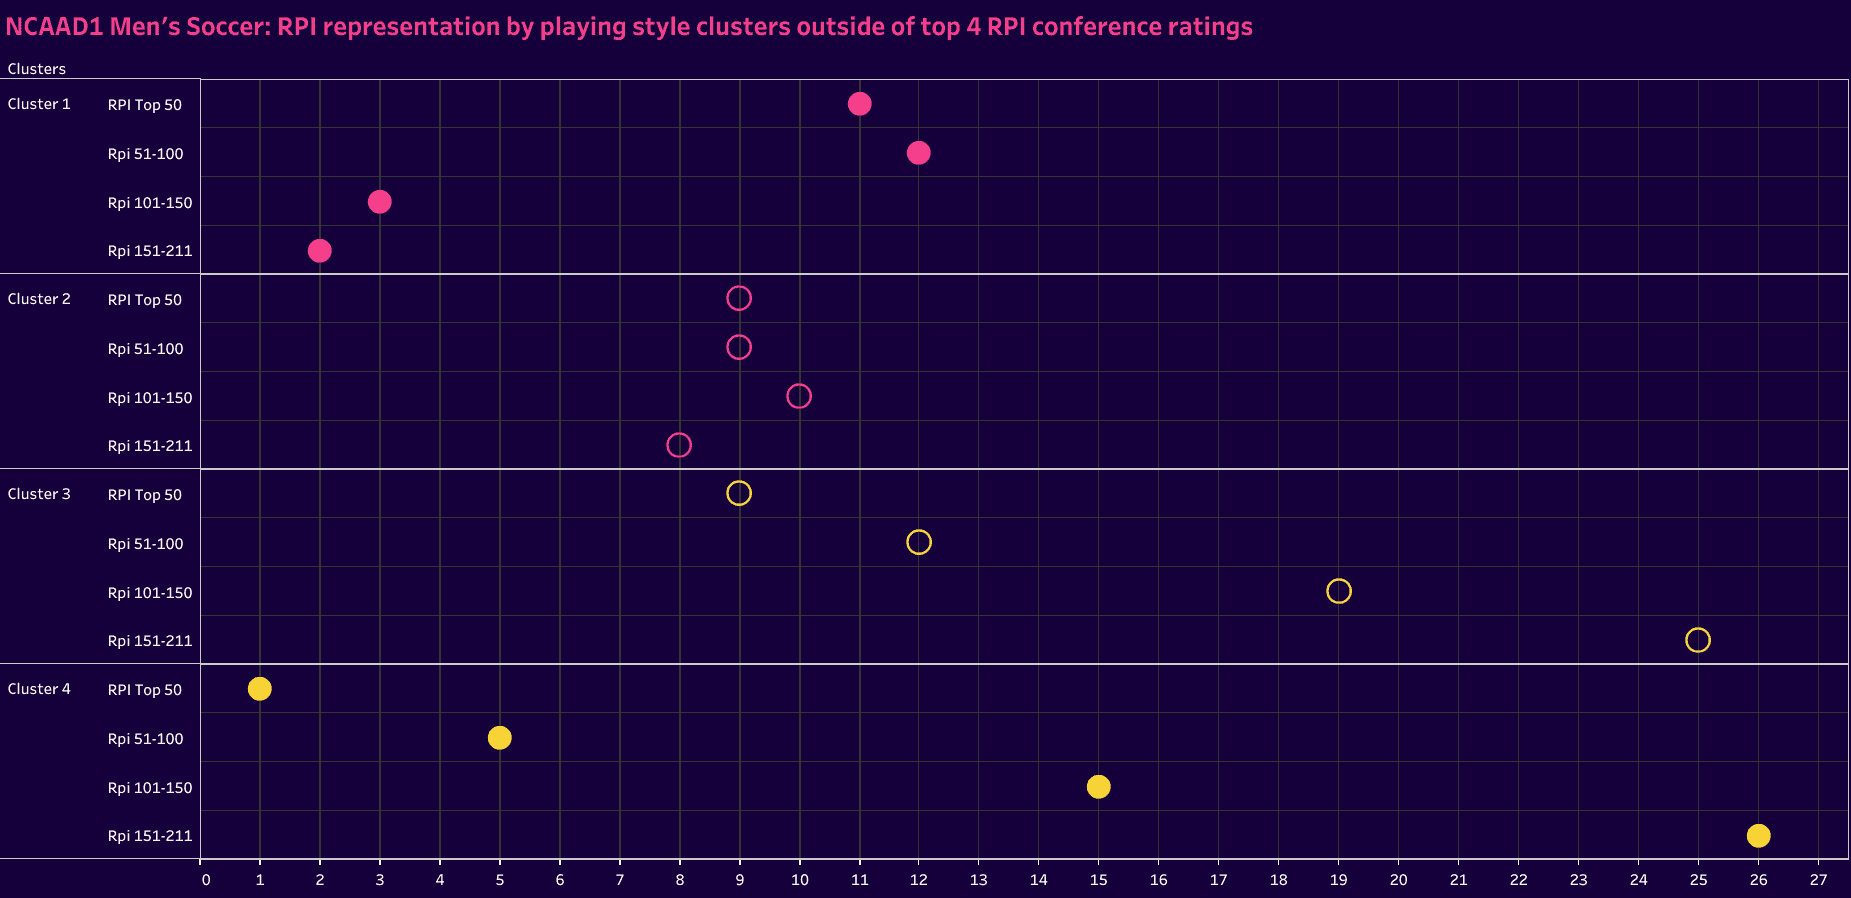
Looking outside of the top four conferences by RPI, we return to a more standard placing on the graph. The more possession-dominant teams in Cluster 1 are far and away the leaders, followed at a distance by 2.
![]()
The distance between Clusters 2 and 3 is closer than that of 1 to 2 and 3 to 4, but that second group has a clear advantage in both average and median ratings.
Cluster RPI distributions
Let’s dig into those RPI distributions.
To take a closer look at the RPI distribution, this section has broken the teams into four groups: 1) 1-50, 2) 51-100, 3) 101-150 and 4) 151-211. Breaking the teams into quartiles will give us an idea of where each cluster has the highest presence within the NCAA D1 landscape.
Much like the last section, this one will first look at the entire body of 211 teams, followed by the top four performing conferences and then a third chart for the teams that fell outside of that range.
With these graphs, the further to the right a cluster is, the more teams they have within that range. That first group, for example, places the majority of its teams within the top 100 with the highest quartile presence within 1-50 in the RPI rankings.
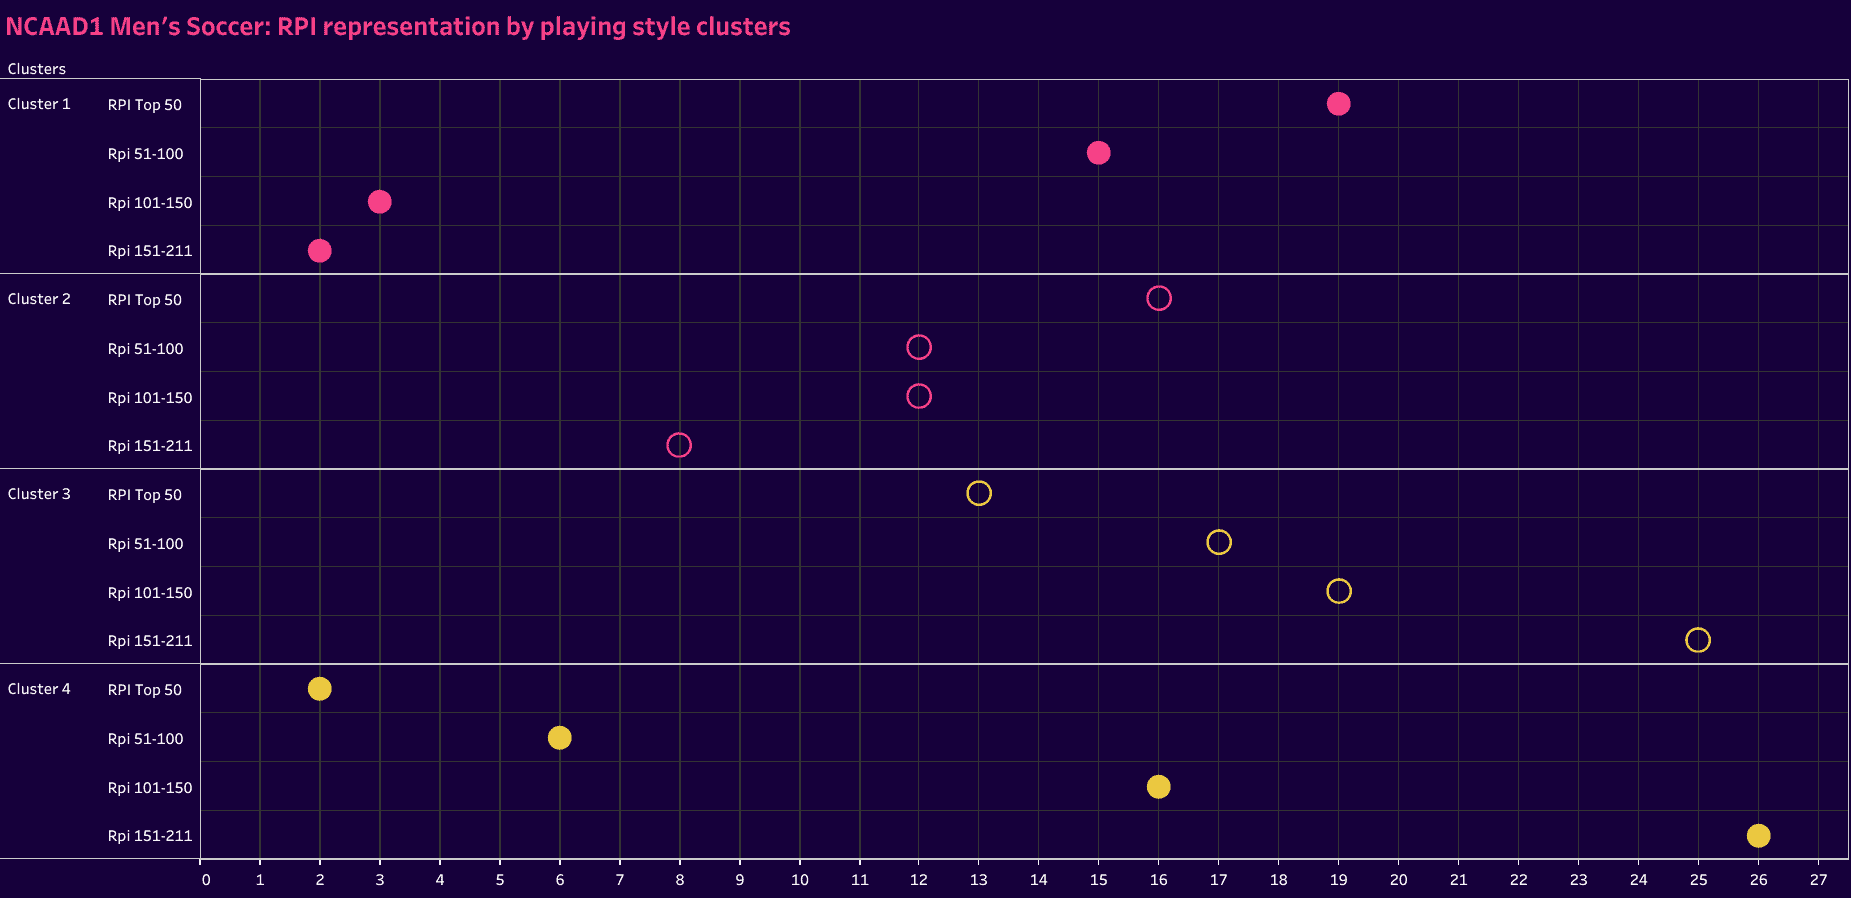
So does the second quartile. It has 16 teams ranking from 1-50, but we start to see more balance in the other three quartiles. It has 12 teams ranging from 51 to 100 and 101 to 150 each. We can also see that the back end of the rankings has pushed to the right, as we saw with the first cluster.
Clusters 3 and 4 have the heaviest presence between 151 and 211. In fact, both work from right to left rather than left to right, like the first two groups. Cluster 4, our Cadiz-style group, only features two teams in the top 50 and eight teams overall in the top 100. Whereas Cluster 3 has points that are more closely grouped, Cluster 4 spans the length of our scale with several large gaps in between points.
Focusing our attention on just the top four conferences, we find that every Cluster 1 team finished within the top 100, with eight of its eleven representative teams finishing in the top 50. Cluster 2 has a similar distribution but with the exception of adding two teams to the 101 to 150 grouping.
We can also see the difference between the top four conferences and the NCAA as a whole. Very few teams fit into Clusters 3 and 4. Cluster 3 is still decently represented with nine teams, but we can see the numbers trailing off. Once we get to Cluster 4, only three teams from the top four conferences fit our statistics-derived groupings.
Looking at the remaining conferences, we find an interesting regression. To start, Cluster 1 has two pairings: the top two quadrants, followed by the bottom two quadrants. It has one more 51-100 rated team than 1-50, but the numbers are nearly identical.
Cluster 2 is one team’s movement away from total balance across the board, showing teams that pull off the tactics well and others that are still missing something in their approach.
Going to Cluster 3, we continue to see less representation of the top two quadrants relative to the bottom two. The distance between the points is nearly uniform, and the gap is significant, but not to the degree that we see with Cluster 4. This group has one team in the top 50, six total from 1-100, and then another 41 teams in the back half of our groupings.
Breakdown of NCAA Tournament results
One of our objectives is to use statistics to figure out how styles of play are spread across the college game, but then we also want to correlate the data to the most successful football philosophies within NCAA soccer.
There’s no better place to examine the efficacy of playing styles than with a data analysis of the NCAA tournament. Here, we can see a representation of each of the clusters at the tournament, as well as their success rates. The added benefit is the opportunity for an analysis of the interactions between clusters. In other words, when one cluster plays another, which is more likely to succeed?
The benefit of analysing the tournament is that it’s restricted to conference champions and the remaining top-rated teams. In this previous season, there were 23 conference champions in a field of 48. The automatic births given to conference champions don’t always ensure the best team enters the tournament. However, this is as close as we’ll get to a direct comparison of playing styles while looking exclusively at top teams.
First, we want to get a sense of representation within the tournament field. The chart below shows not only the number of teams each cluster started with but also the number of teams that continued through the rounds. Cluster 2 had the highest representation with 21 teams, including Notre Dame, the finalist, and three semi-finalists. Mike Noonan’s Clemson Tigers, the NCAA D1 Champions for the second time in three years, were the lone team from Cluster 1 to advance to the semis.
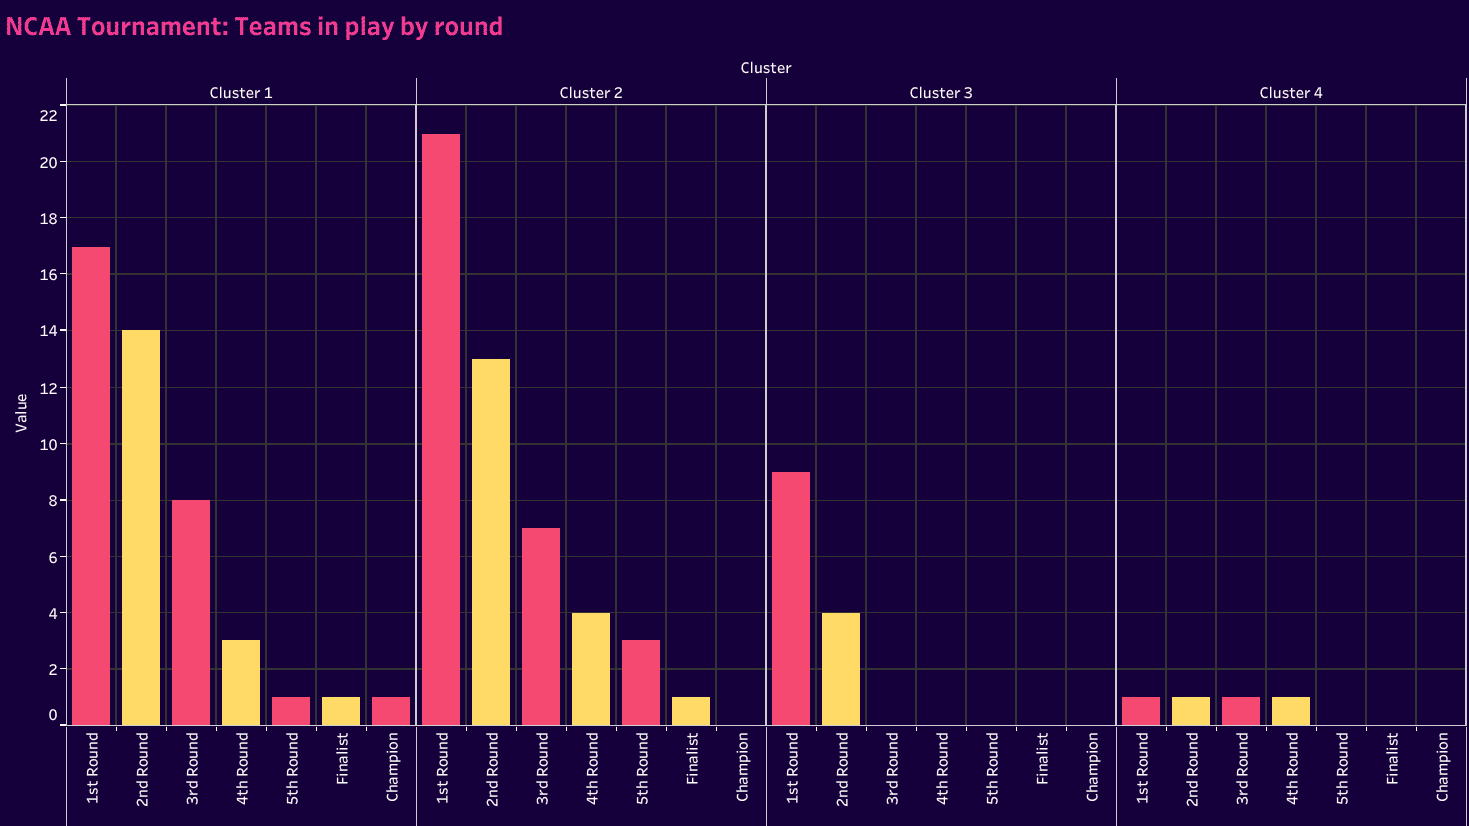
Elsewhere, Cluster 3 started with nine teams, but none made it to the third stage, the round of 16. Cluster 4 had just one team, LMU, but they were a Cinderella story of the tournament, reaching the quarterfinals.
Now, to see how they fared against each other. Let’s start with LMU. They recorded a win against a Cluster 1 team, UCLA, and another two wins against the second cluster, UC Irvine and James Madison, before falling to Cluster 2 team West Virginia double check this.
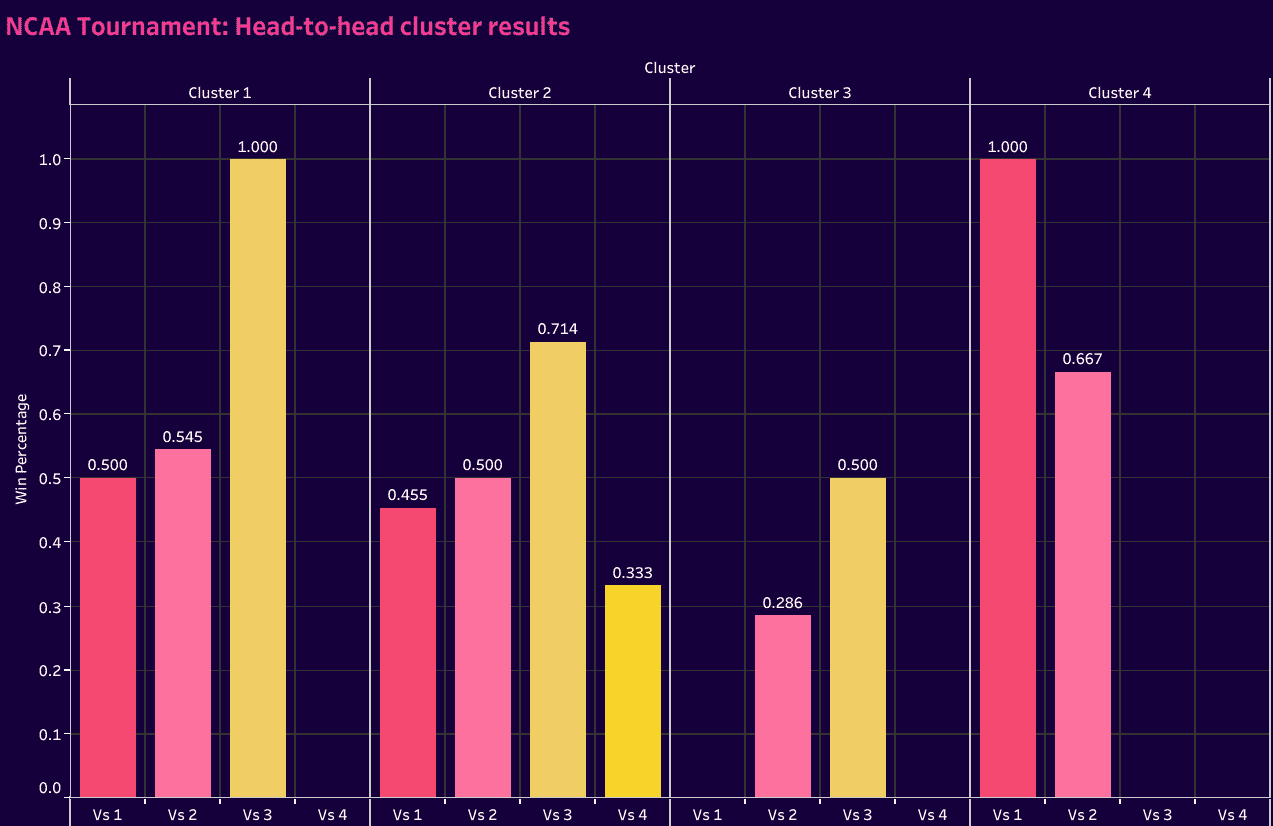
Cluster 1 had two matches against Cluster 3 and won both. The 22 games between Clusters 1 and 2 were very close. Twelve went to Cluster 1, showing that Cluster 2 is generally able to go toe to toe with that first group while picking up 10 wins.
Cluster 2 did very well against Cluster 3 as well. This is perhaps where we see the limitations of clusters 3 and 4. Not only did they have fewer teams in the tournament, but with the exception of LMU, success was very limited as well, winning five out of seven games. The old adage of playing not to lose while taking a rigid defensive approach with a heavy reliance on counterattacks and set pieces simply didn’t pan out for the Cluster 3 teams.
Conclusion
One clarification is that we don’t want to extend that last conclusion to football as a whole. Similar studies need to be done across additional leagues or tournaments to test the validity of that theory relative to specific competitions. With its salary cap, MLS is an example of a league that would make a good case study. In fact, each of the American leagues would.
Knockout tournaments may be another area. In the UEFA Champions League, the winners always seem to come out of Cluster 1 or 2 type teams. The Cluster 3-types, like Atlético Madrid and Juventus, have historically made runs deep into the tournament, but they haven’t quite gotten over the hump in recent decades.
Finally, the same kind of study can be done at the international level. In terms of the data, it wouldn’t surprise me if the past two winners, Argentina and France, fell into Cluster 2 while the two winners before them, Germany and Spain, fit into Cluster 1.
As for this study, we have a better understanding of the representative styles of play within NCAA D1 men’s soccer and how those playing philosophies correlate to successful results.
The tournament angle gives a little more value. For the top-tier teams, fitting into the first two clusters carries a greater weight in ensuring success, but it has to be done well and fit the level of the talent on hand.
For middle-tier teams within each conference, Clusters 2 and 3 typically offer the greatest return. They may get you into the tournament, but there’s a clear indication that Cluster 3 does come with limited success once teams get to the final rounds of knockout play.